2026 observability trends and predictions from Grafana Labs: unified, intelligent, and openAIAdaptive TelemetryOpenTelemetrySLOs
Baking in site reliability with observability and AI: How SpotOn uses Grafana Assistant to keep restaurants runningAI
The observability maturity curve: How IT leaders are shifting from tools to outcomesGrafana CloudSLOsAI
Grafana Labs Co-founder Woods: Market maturity, OpenTelemetry, and AI are reshaping observabilityOpenTelemetryAI
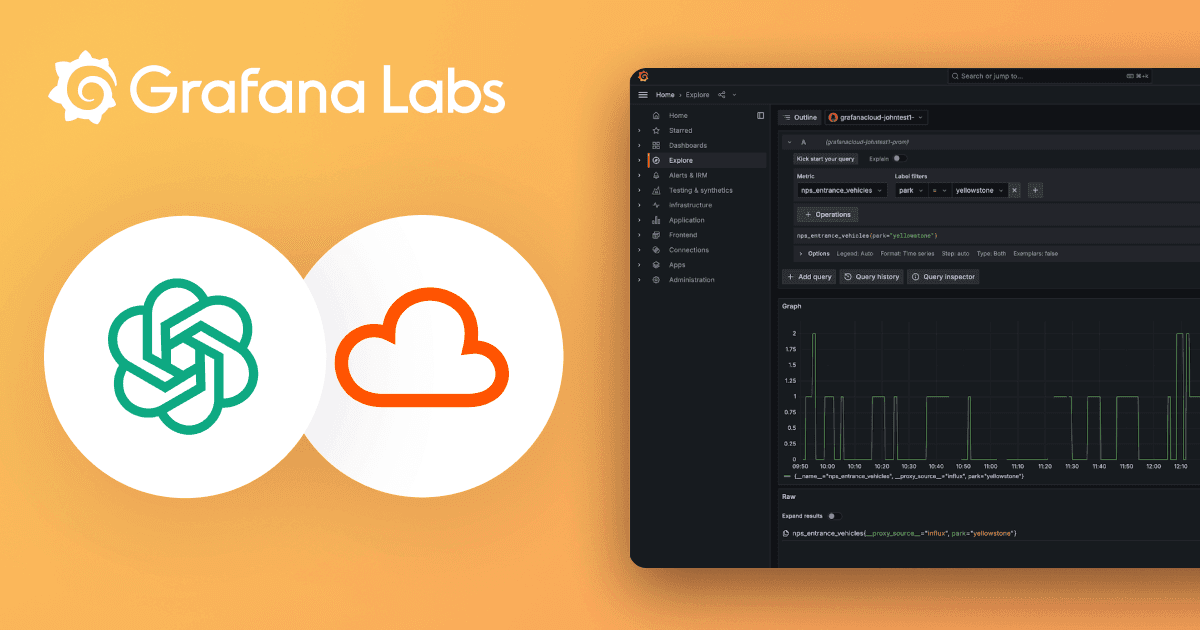
How to monitor Claude usage and costs: introducing the Anthropic integration for Grafana CloudGrafana CloudAI
LLM-powered insights into your tracing data: introducing MCP support in Grafana Cloud TracesGrafana Cloud TracesAI
Adaptive alerting: faster, better insights with the new metrics forecasting UI in Grafana CloudAIGrafana CloudAlerting
A context-aware LLM agent built directly into Grafana Cloud: Introducing Grafana AssistantAIGrafana Cloud
Grafana LLM plugin updates: choose the large language models and providers that work best for youAIPlugins
Monitor your generative AI app with the AI Observability solution in Grafana CloudAIIntegrationsGrafana Cloud
A complete guide to LLM observability with OpenTelemetry and Grafana CloudAIOpenTelemetryGrafana Cloud
Identify anomalies, outlier detection, forecasting: How Grafana Cloud uses AI/ML to make observability easierAISiftPluginsIntegrationsGrafana CloudGrafana Cloud IRM
AI-powered insights for continuous profiling: introducing Flame graph AI in Grafana CloudContinuous profilingGrafana Cloud ProfilesAI
AI-powered diagnostics for incident response: New Sift features in Grafana IRMGrafana IncidentMachine learningAIMTTRSift
Taylor Swift (Grafana’s Version): How to track and visualize data related to pop’s biggest superstarGrafana CloudAI