

OpenTelemetry and Grafana Labs: What’s new and what’s next in 2026
For many teams, 2024 was the year of asking, “can OpenTelemetry do this?” In 2025, the community answered with a resounding “yes,” moving beyond experimentation to focus on what matters most in practice: stability, ease of use, and cross-project compatibility.
That momentum now sets the stage for what’s to come for OpenTelemetry in 2026.
Grafana Labs is fully committed to the open source OpenTelemetry project, with several Grafanistas (myself included) actively maintaining and contributing to the project. From the stabilization of certain Semantic Conventions to introducing OpenTelemetry eBPF Instrumentation, here’s a look back at some key OpenTelemetry project milestones in 2025 and a glimpse at what’s next.
Technical milestones for OpenTelemetry in 2025
Through both new capabilities and the maturation of existing ones, OpenTelemetry continues to gain momentum and grow. In the past 12 months, the community has especially focused on making the instrumentation of applications easier and generating actionable telemetry data.
OpenTelemetry eBPF Instrumentation
In 2025, Grafana Labs donated Beyla — the open source eBPF-based, zero-code instrumentation tool — to OpenTelemetry under the new project name OpenTelemetry eBPF Instrumentation (commonly referred to as OBI). This marked a significant milestone in the evolution of zero-code eBPF instrumentation within the open source community and, since the donation, the development of eBPF instrumentation has sped up significantly, with new protocols being added, quality improvements, and more.
Semantic Conventions stabilizations
An important part of OpenTelemetry is standardizing how different kinds of operations, components, and data are described. This is largely achieved through OpenTelemetry Semantic Conventions.
In 2025, the community marked the Database Semantic Conventions as stable, meaning whether you’re using PostgreSQL, MySQL or some other database, your telemetry looks and acts the same across instrumentations.
There was also a lot of progress related to the Declarative Configuration, which is approaching stabilization and moving us closer to a world where OTel SDKs can be configured via simple YAML files rather than complex code. It's possible to find different levels of implementation of this feature in a few SDKs: Java, Go, PHP, JavaScript and C++.
Other notable updates
The OpenTelemetry project had over 4,000 contributors in 2025, making it tough to cover every update in a single blog post. That said, here are a few other notable enhancements from the past year:
- The Instrumentation Explorer was created to help inspect instrumentations, see emitted telemetry, and compare behavior across versions and configurations. A proof of concept was done in Java, and other languages will be added incrementally.
- The .NET SDK added support for .NET 10 and NLog instrumentation, and is working towards SQL Server database stability.
- The Rust SDK Tower package has the stable implementation for HTTP Server Metrics Semantic Convention.
- There was added support for complex attributes specification and continued efforts on documentation localization.
- You can now promote a predefined list of OpenTelemetry resource attributes as metric labels in the Prometheus OTLP endpoint.
OpenTelemetry at Grafana Labs
While Grafana Labs continues to contribute directly to the OpenTelemetry project, we also prioritize building and expanding OTel compatibility within our products and open source projects. From native OTLP ingestion to advanced fleet management, here are some examples of how we did this in 2025.
Database enhancements
Loki has been refactored to use the OpenTelemetry tracing library, instead of the OpenTracing library.
Mimir significantly improved OTLP ingestion performance, including multi-zone OTLP ingestion, and added support for untranslated metric and label names. The open source time-series database now also supports partial success responses (HTTP 200) for OTLP writes, ensuring data flow isn't interrupted by minor validation errors.
Fleet Management
While managing a few collectors is easy, managing thousands is not. Grafana Fleet Management, a Grafana Cloud feature that enables you to manage collector deployments at scale, helps address this scalability challenge.
Recently, we opened a private preview of OpAMP (Open Agent Management Protocol) support in Fleet Management, which allows you to manage more OpenTelemetry Collector distributions.
Performance and UX improvements
Thanks to design work that made Prometheus "schema-aware," PromQL queries in Mimir can now tolerate schema evolution, ensuring your dashboards don't break when your OTel data structure changes.
We also contributed improvements to the OpenTelemetry Demo, updating OpenTelemetry configurations, Grafana dashboards, and Prometheus alerts. These enhancements support infrastructure and application monitoring, as well as monitoring of the OpenTelemetry Collector itself.
Here’s an example of the new lightweight APM dashboard for the OpenTelemetry Demo:

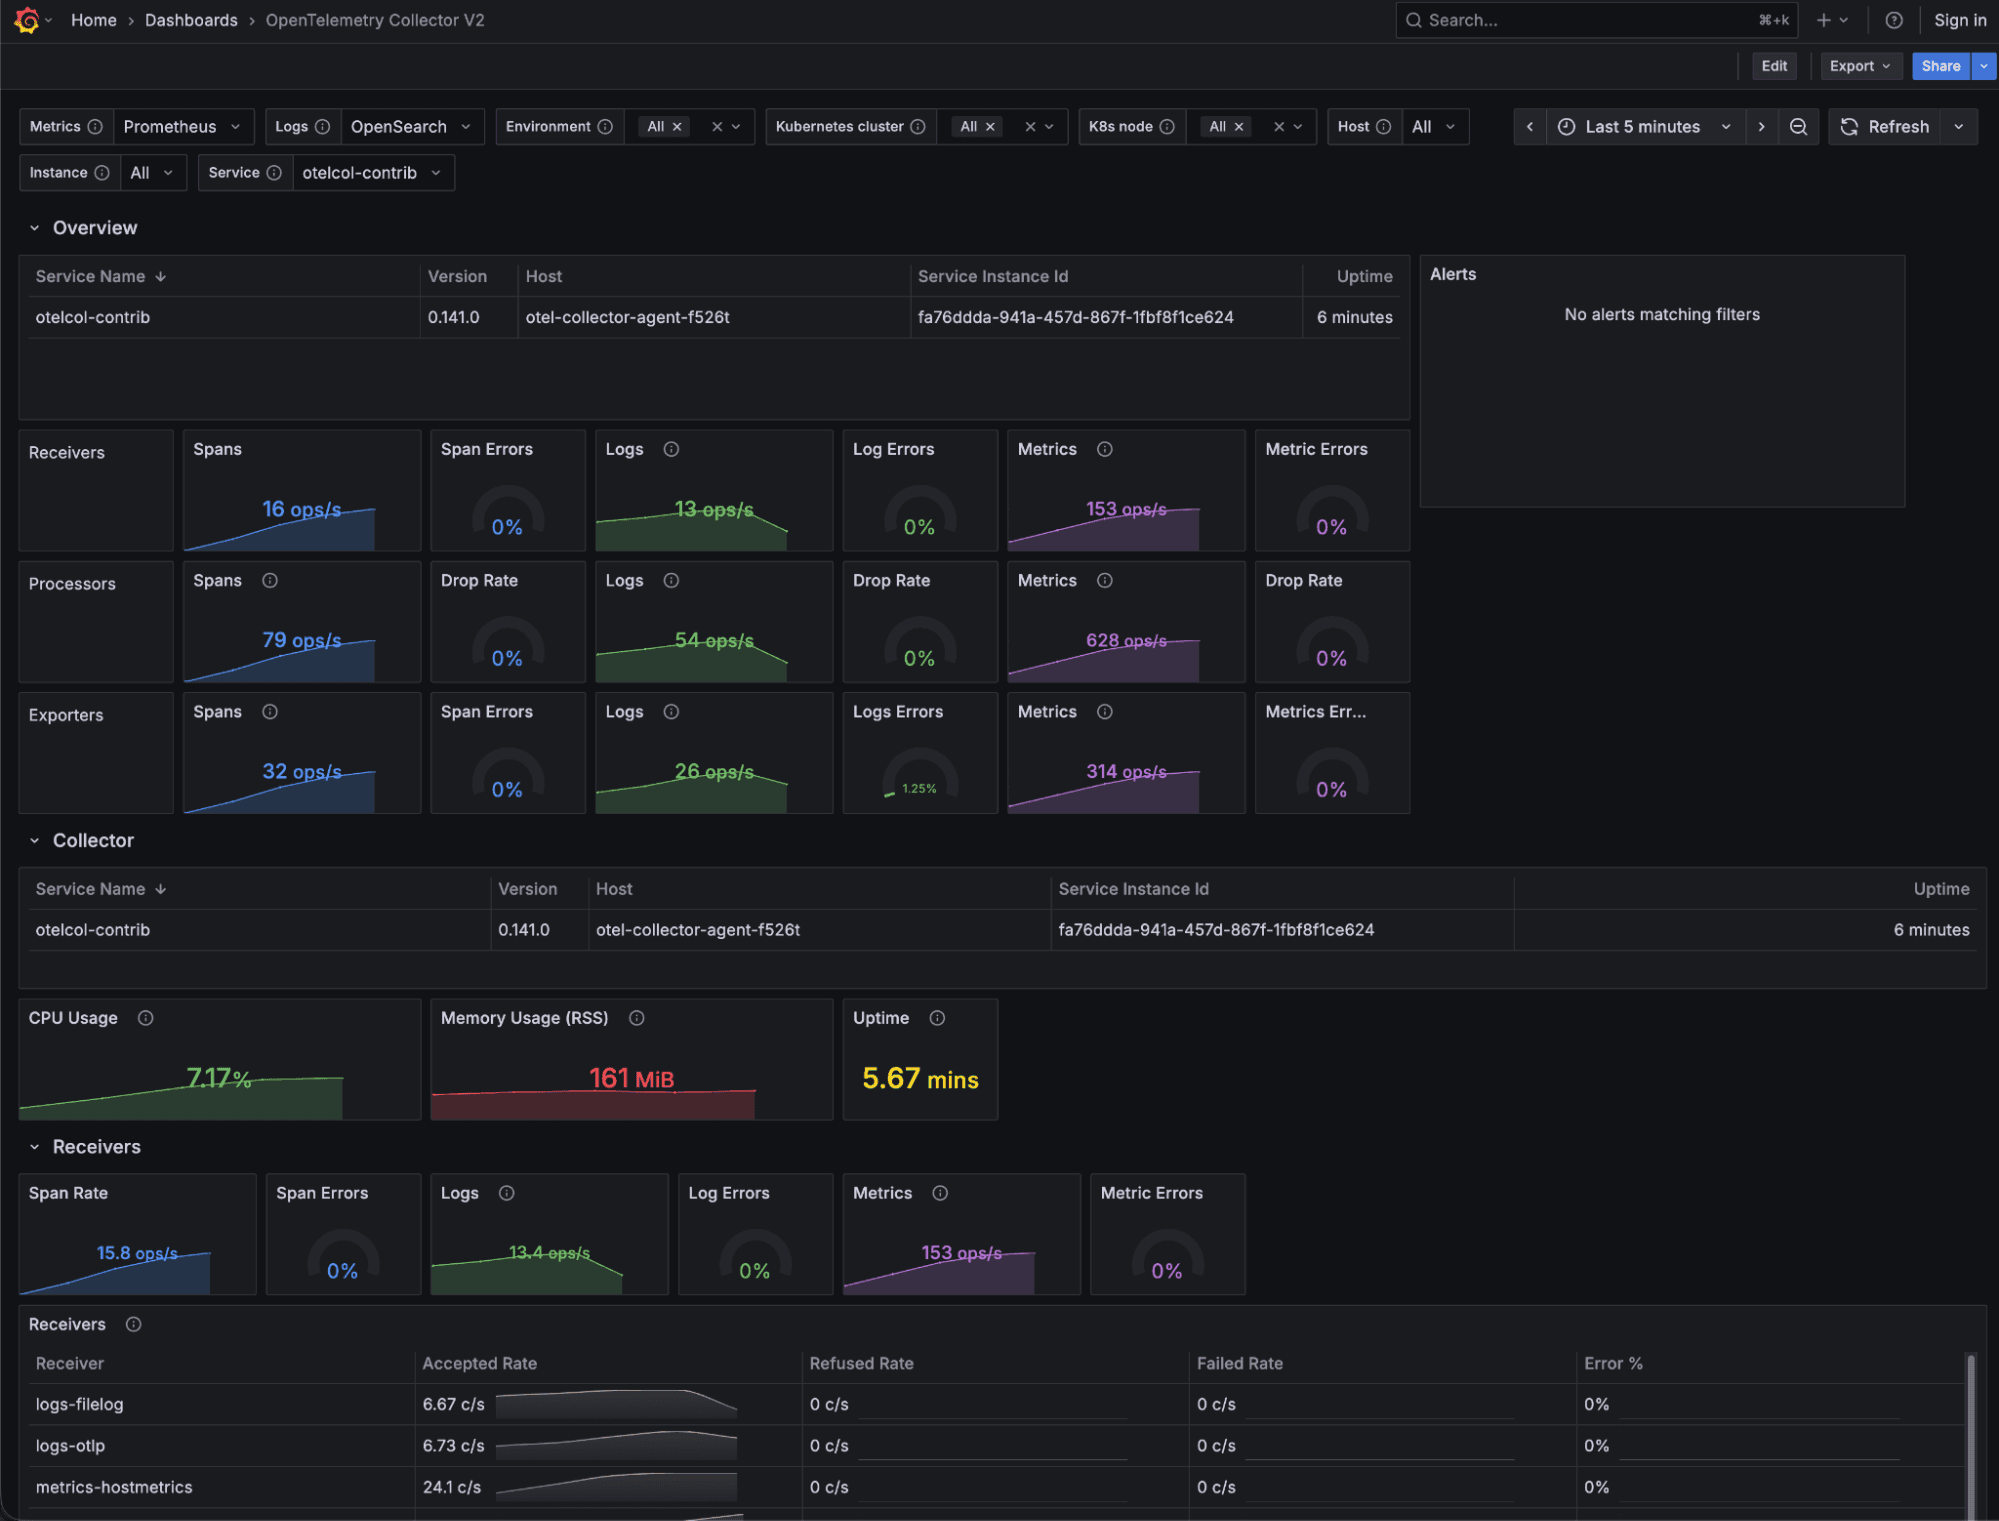
Here’s the new OpenTelemetry Collector monitoring dashboard for the Demo:
And, lastly, here’s the Linux monitoring dashboard for the Demo:

Beyond the code: Community and leadership
Technical features are only part of the story. For Grafana Labs, 2025 was also about educating and empowering observability practitioners within the OTel community.
Grafanistas were active across the globe, sharing OTel best practices at some of the industry's biggest events. We’ve also grown the Grafana & Friends Meetup series into a vibrant global community, with meetups covering everything from eBPF deep dives to OTel-native instrumentation. If you haven’t already, we’d love for you to join us at a local chapter.
We partnered closely with the OpenTelemetry community to produce the "OTel for Beginners" video series on YouTube, and to create OTel Unplugged, an upcoming “unconference” shaped by and for the OpenTelemetry community.
Through Linux Foundation and CNCF mentorship programs, we’ve also worked with aspiring engineers on projects like the OTel Collector and Prometheus, helping ensure the ecosystem remains healthy and diverse for years to come.
Lastly, at Grafana Labs, we believe that the best way to advance the industry is to give back to the projects we rely on, which is why we dedicate significant engineering hours every week to the OpenTelemetry project.
We are incredibly proud to have a growing cohort of Grafanistas serving as maintainers, approvers, and triagers across several OpenTelemetry repositories. In 2025, we also expanded our leadership presence in the project: we now have two Grafana Labs’ team members (Liudmila Molkova and Jack Berg) on the OpenTelemetry Technical Committee, and two team members (Ted Young and myself, Marylia Gutierrez) on the Governance Committee. This ensures that we aren't just following the open standard, but are actively working alongside the community to make it more stable, vendor-neutral, and accessible for everyone.
What's next?
In 2026, OpenTelemetry will continue working towards becoming a Graduated CNCF project. This milestone will be more than just a badge; it will be a signal to the world that OTel has reached the highest level of maturity, security, and adoption.
We will continue to focus on the stabilization and development of features that will make instrumenting your application easier and generating the best data. For example, there are a few other Semantic Conventions, such as RPC and MCP, that are currently in progress.
The Prometheus Receiver, which is one of the most popular components of the OpenTelemetry Collector, is soon to be marked as stable, ensuring teams using Prometheus can confidently use the Collector as their primary gateway without fear of breaking changes.
We can’t wait to see what else the new year brings, and look forward to more collaboration and innovation within the OpenTelemetry community.

