

Grafana community dashboards: Memorable use cases of 2025
Every year, Grafana dashboards surface in new corners of the world. And this year, they even reached beyond this world—helping one team land on the moon and another monitor the planet’s health with orbiting satellites.
Meanwhile, back here on Earth, the community used Grafana to track everything from wind turbines and wastewater to March Madness and Taylor Swift’s worldwide tour.
Here’s a look back at some of the most memorable Grafana community dashboards of 2025.
Grafana in space
Lunar-level observability with Firefly Aerospace
On March 2, Firefly Aerospace’s Blue Ghost Mission 1 completed the first fully successful commercial moon landing. Behind the scenes, mission control relied on Grafana dashboards as their primary window into the lander’s health. Subsystems streamed real-time telemetry so engineers could spot anomalies instantly and make mission-critical calls.

Firefly had visualizations for each phase of the mission: launch, cruise, lunar orbit, descent, and surface operations. The dashboards also provided key metrics, such as voltages and currents, altitude and range distances, vertical acceleration, and more. The result was an accurate, comprehensive picture of the spacecraft’s health.
Jesus Charles, the flight director of Blue Ghost Mission 1, shared their story at GrafanaCON 2025, where a broader trend emerged: organizations treating Grafana as a standard visualization layer that delivers observability far beyond server racks and data centers.
Pixxel’s health monitor for the planet
Also in 2025, hyperspectral Earth-observation company Pixxel launched its first satellites to track pollution, vegetation, water quality, land-use changes, and more. Large displays in mission control shared Grafana dashboards that monitored high-level spacecraft health indicators, such as voltage and current, with the entire team.

Additional dashboards at individual workstations provided granular views into the status of each satellite. With this consistent, real-time view, Pixxel got a complete picture of performance without having to use multiple tools and screens.
Grafana here at home
Space may be the final frontier for Grafana dashboards, but 2025 demonstrated the breadth of their use cases here on Earth as well.
A research team in Spain studied marine wind turbine performance, using Grafana dashboards to visualize power output, rotational speeds, and structural response. Continuous sensor data was visualized in Grafana, helping researchers see how changing wind speeds and sea conditions affect turbines.

The BBC Research and Development Sustainable Engineering team also relied on Grafana for environmental work. They tracked the energy usage and estimated carbon footprint of cloud computing workloads so architects could compare deployment choices through the lens of environmental impact—not just cost or latency.

Elsewhere in the U.K., when the Great Western Railway broke the record for the longest distance traveled by a battery-powered train—on a 200-mile overnight trip between Reading, London and Oxford—a Grafana dashboard provided key telemetry, including battery percentage, distance traveled, and GPS location. Efficiency figures and remaining capacity were also monitored to validate how far the train could travel on a single charge.

And at GrafanaCON 2025, Arthur Kepler shared how his family’s off-grid, solar-powered apple orchard uses open source tools to monitor and automate operations. A local stack of ESP-based devices, custom firmware, MQTT, InfluxDB, and Grafana works together to irrigate trees, monitor pumps and valves, and analyze flow rates and power levels. A tablet in the orchard’s cabin displays data on battery charge, solar production, and more, so it's easy to make day-to-day decisions at a glance.

Golden Grot winners
The annual Golden Grot Awards celebrate the community’s best personal and professional dashboards. In 2025, the winners were Grant Chase and Ruben Fernandez.
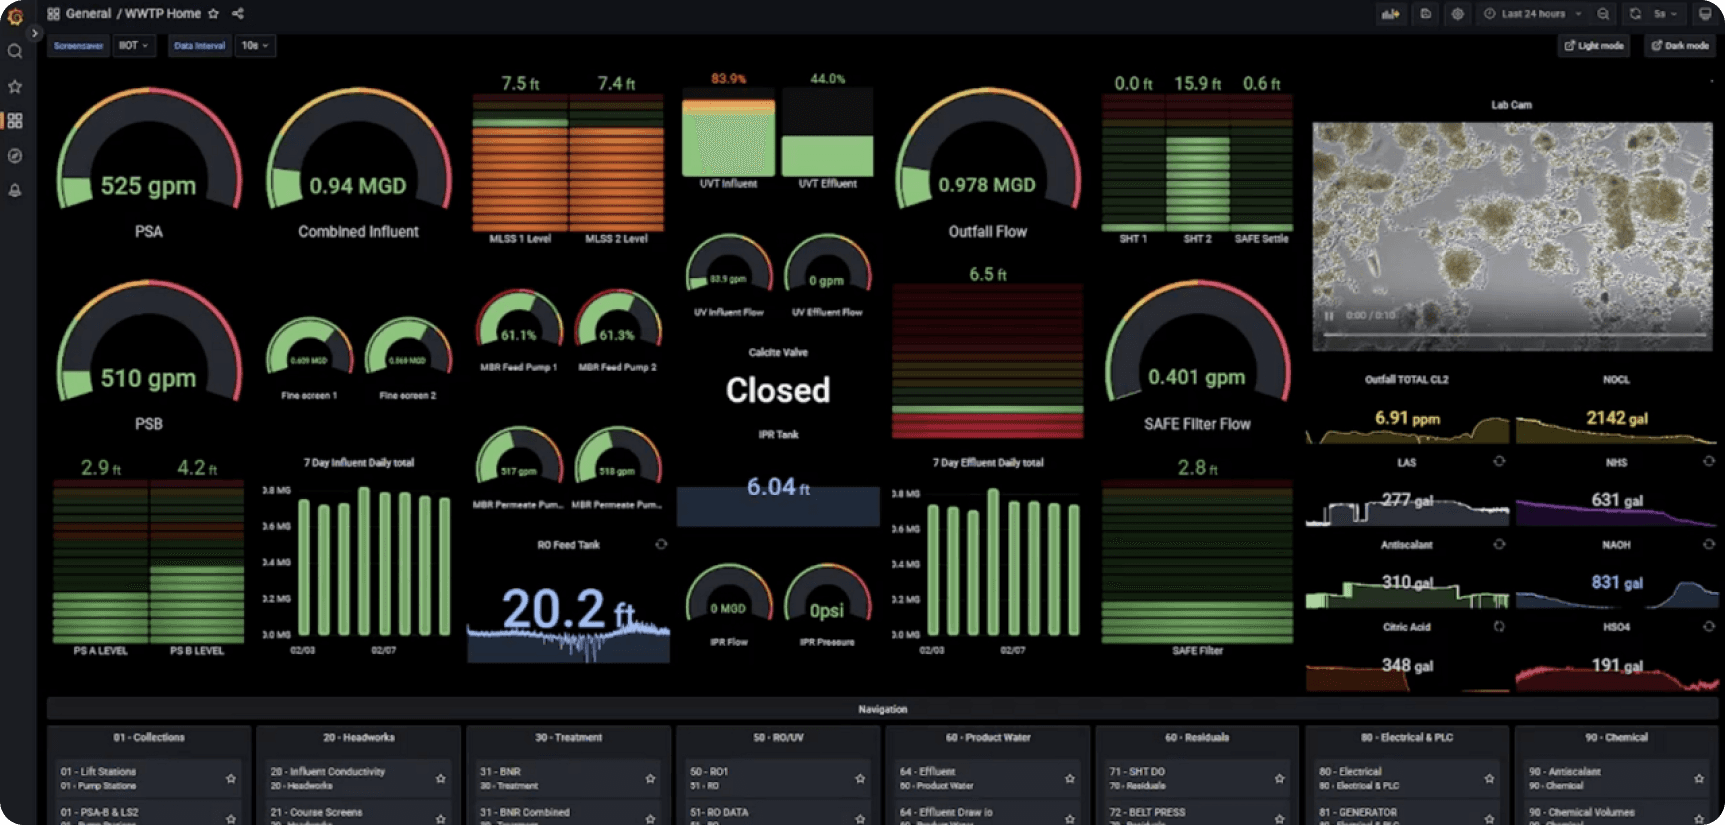
Keeping wastewater systems flowing
Chase, an operational technology specialist, used Grafana to modernize operations at the municipal wastewater treatment plant in Morro Bay, California. He built a data pipeline in Python using Modbus TCP, storing it in InfluxDB, and visualizing it entirely in Grafana.
Now, when something happens at the plant, the team checks Grafana first, using the dashboard to understand what changed, why it happened, and what to do next.
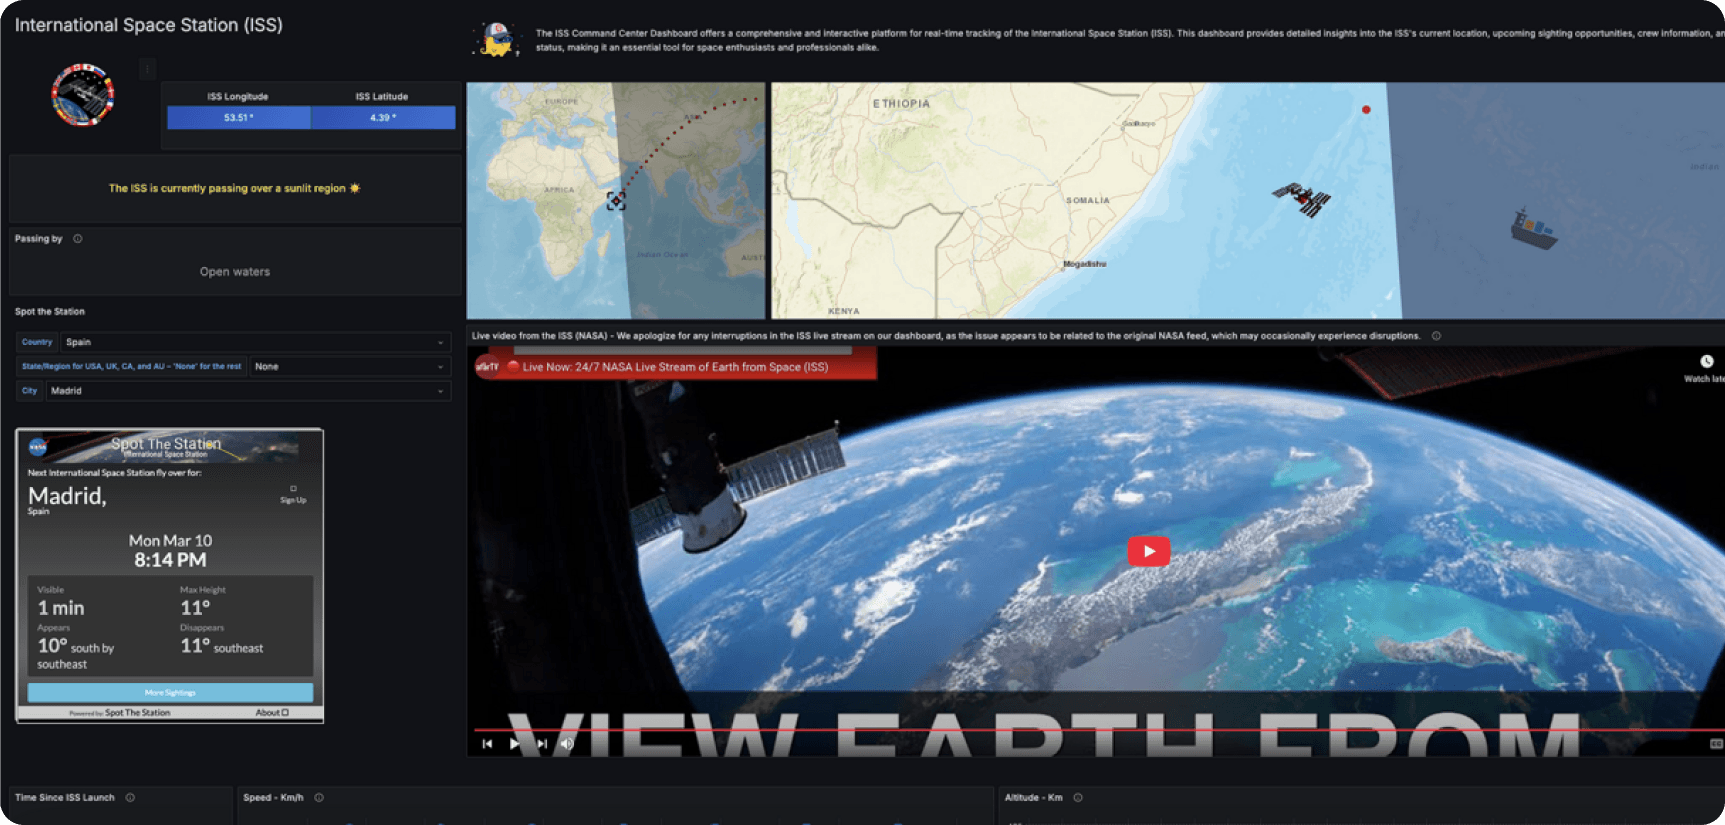
Monitoring the International Space Station
Fernandez, a principal engineer at Dell Technologies, leaned on his longtime passion for space to build a Grafana dashboard that tracks the International Space Station (ISS). It combines a live video feed from the station with real-time telemetry, showing the station’s current position, docking status, crew information, and more.
The combination of real footage from orbit and the data behind it creates a unified view of everything happening on the ISS.
Grafana for fun
Other standout dashboards in 2025 used Grafana to explore everyday annoyances, fandoms, and hobbies.
If it’s gotta be clean, it’s gotta be observable
Cole Bentley and Dakota Roth built a Grafana dashboard to track the washers and dryers in Bentley’s college dorm. After discovering the laundry machines exposed data through service tags and QR codes, they wrote a script to collect JSON from their APIs every minute.

Bentley and Roth use Grafana OSS to visualize 32 machines, showing their availability status, time remaining, machine type, water temperature, heat level, and other data. The dashboard refreshes automatically, revealing patterns that make laundry days more predictable for other dorm mates.
Taylor Swift (Grafana’s version)
It was anything but a cruel summer for four Grafana Labs employees who built a Taylor Swift dashboard ahead of the release of Swift's new album, "The Life of a Showgirl." Grafana Assistant helped the group generate panels, run queries, and refine layouts with natural language, making it easier for everyone to contribute regardless of their experience level. The result was a visual overview of Swift’s career, covering everything from milestones to musical analytics.

One tab introduces the eras of Swift’s career through text panels filled with a timeline and fun facts, while others visualize concert data and examine the new album. Another tab even uses a Kaggle data set in BigQuery to chart danceability, energy, and other characteristics of songs across her catalog.
A Star Wars data saga
Ronald McCollam, a solutions engineering manager at Grafana Labs, built a Star Wars-themed dashboard, complete with Millennium Falcon system readouts and a rundown of the Death Star’s vulnerabilities. He even recreated the films’ classic opening text scroll, using a stat panel instead of a text panel.

McCollam built readouts for the Falcon’s missile tubes and live-updating gauges for shields and lasers, with simple simulations keeping values in believable ranges. Grafana’s streaming mode updates those visuals without reloading, making the panels feel active even though no real telemetry exists. The techniques mirror real workflows: mocking up dashboards, testing visual structures and experimenting with different panel types before connecting to actual data.
Brackets, gardens, boats, and more
The creativity of the Grafana community stretched further than ever in 2025. Here are just some of the other unique dashboards we spotted throughout the year:
- A March Madness dashboard combined live score feeds, bracket projections, and win-probability visualizations for the NCAA basketball tournament so fans could track dozens of games at once.
- Grafana Cloud, Arduino, and Prometheus combined to help a family monitor their houseplants. IoT sensors feed soil moisture, light intensity, and temperature data into a dashboard for hands-on lessons in plant care and observability.
- Project Bob, an open source autonomous boat aiming to circle the globe, used dashboards tracking GPS location, battery levels, and system health during its voyage on the seas.
- Neuralink shared a Grafana dashboard with details from the 12 people living with their brain implants, charting how long they’ve had their devices and their hours of use.
- The Meeting Cost Calculator computed the real-time cost of business meetings by analyzing participant roles and salaries—and upped the fun factor with an interactive buzzword bingo card.
- Another dashboard monitored live progress on Original Prusa 3D-printing jobs by tracking nozzle temperature, bed temperature, print duration and time remaining.
- A home energy dashboard tracked a refrigerator’s power consumption using a smart plug sensor to help identify patterns in usage and potential savings.
The best Grafana dashboards of 2025 touched on nearly every aspect of our lives, from work to music to sports to travel—both on Earth and in space. By treating all data as something worth visualizing and sharing the stories behind those visualizations, observability can help people everywhere make better decisions.
We can’t wait to see what the community comes up with in 2026!
Grafana Cloud is the easiest way to get started with metrics, logs, traces, dashboards, and more. We have a generous forever-free tier and plans for every use case. Sign up for free now!

