
Understand, diagnose, and optimize SQL queries: Introducing Grafana Cloud Database Observability
It's widely acknowledged that most application performance problems stem not from the application itself, but from the underlying database. Slow or inefficient database queries are often the primary cause of these issues, acting as the biggest driver of application performance incidents.
If you've been troubleshooting slow API calls or sluggish services, chances are the root cause likely resides within your database layer. That's why we're excited to tell you about the public preview of Grafana Cloud Database Observability.
Database Observability empowers application developers, SREs, and DBAs to understand, diagnose, and optimize their SQL queries all within Grafana Cloud. You can correlate your data across your entire stack—from application to infrastructure—so you can quickly put together the big picture and understand how your SQL queries are contributing to system-wide performance.
Why you need database-level observability
While application-level observability effectively isolates incidents and points to slow database calls, you're typically on your own from there. You get no insights into the actual root cause, and the database then becomes a black box. Most tools lack crucial query-level insights, confirming the database as the problem but failing to explain why it's slow or how to resolve it. This significant visibility gap hides the true root cause, forcing teams to waste time addressing symptoms instead of the underlying issue.
The modern technology landscape only exacerbates this challenge. Many organizations today have fewer dedicated DBAs and a growing number of developers managing usage of cloud-based database services. This means SREs and application developers frequently find themselves troubleshooting database performance, often without the specialized expertise needed for complex problems. This can lead to overburdened expert DBAs and situations where development and operations teams struggle to collaborate effectively during incidents.
Application developers and SREs need better tools to instantly understand query performance and eliminate database bottlenecks without relying solely on scarce DBA resources. They need to be equipped to quickly move from identifying a slow call to deeply analyzing query execution.
And that's where Database Observability comes in.
How Grafana Cloud gives you the database insights you need
Database Observability includes all sorts of capabilities that can help you understand the state of your database, whether you're looking for a high-level overview or fine-grain details. Next, let's walk through some of these views so you can see all the ways you can leverage our solution.
Explore your database fleet
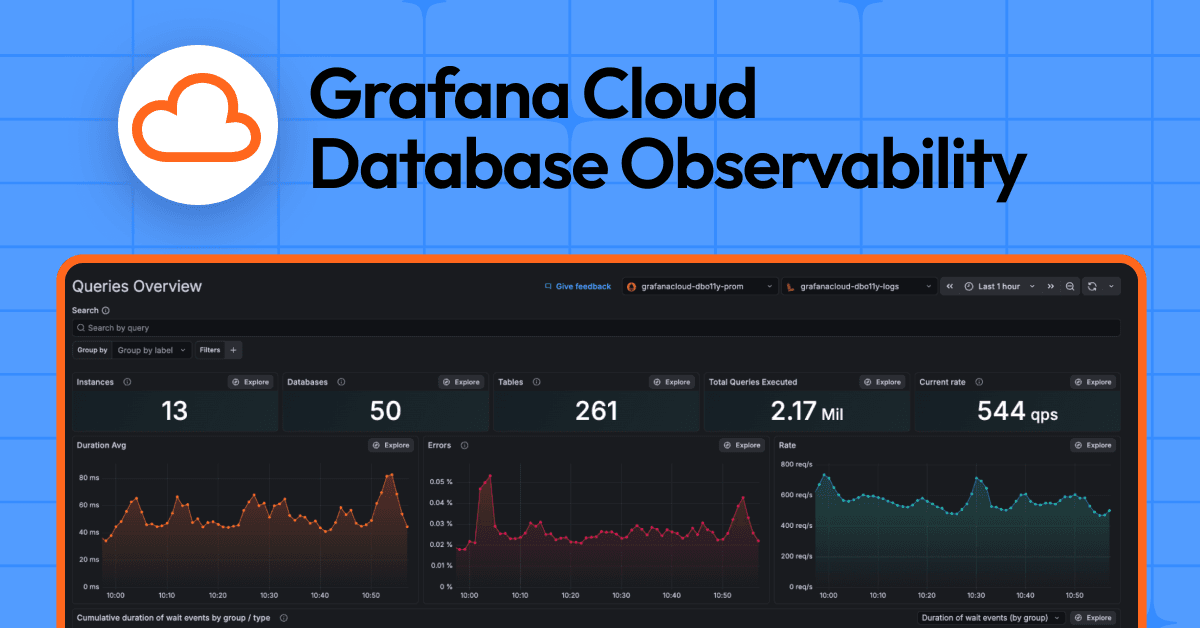
To get started, the first thing you'll see is an overview page that gives you a bird's eye view of your database fleet, making it quick and easy to identify anomalous spikes or trends in behavior through the coveted RED (rate, error, and duration) metrics signals.

While aggregated statistics across your fleet enable insights at a glance, you can also quickly and easily group and filter by specific databases down to the instance level.

You can also view the SQL queries that are running across your database, along with performance metrics including wait event duration, query latency, error rate, and more. And with table sorting, you can quickly identify your worst offenders and jump into query analysis and optimization.

Click on an instance in the column to view correlated cloud provider metrics so you can understand how your infrastructure is affecting query performance. From here, you can quickly navigate into Cloud Provider Observability to view detailed infrastructure dashboards for AWS (and soon Microsoft Azure and Google Cloud, too).

Dive into query analysis
Once you’ve selected a query that requires further investigation, you can open it within the “Query Details” page to view a number of data points and tools that can help you understand current and historic query performance, as well as identify opportunities for optimization.
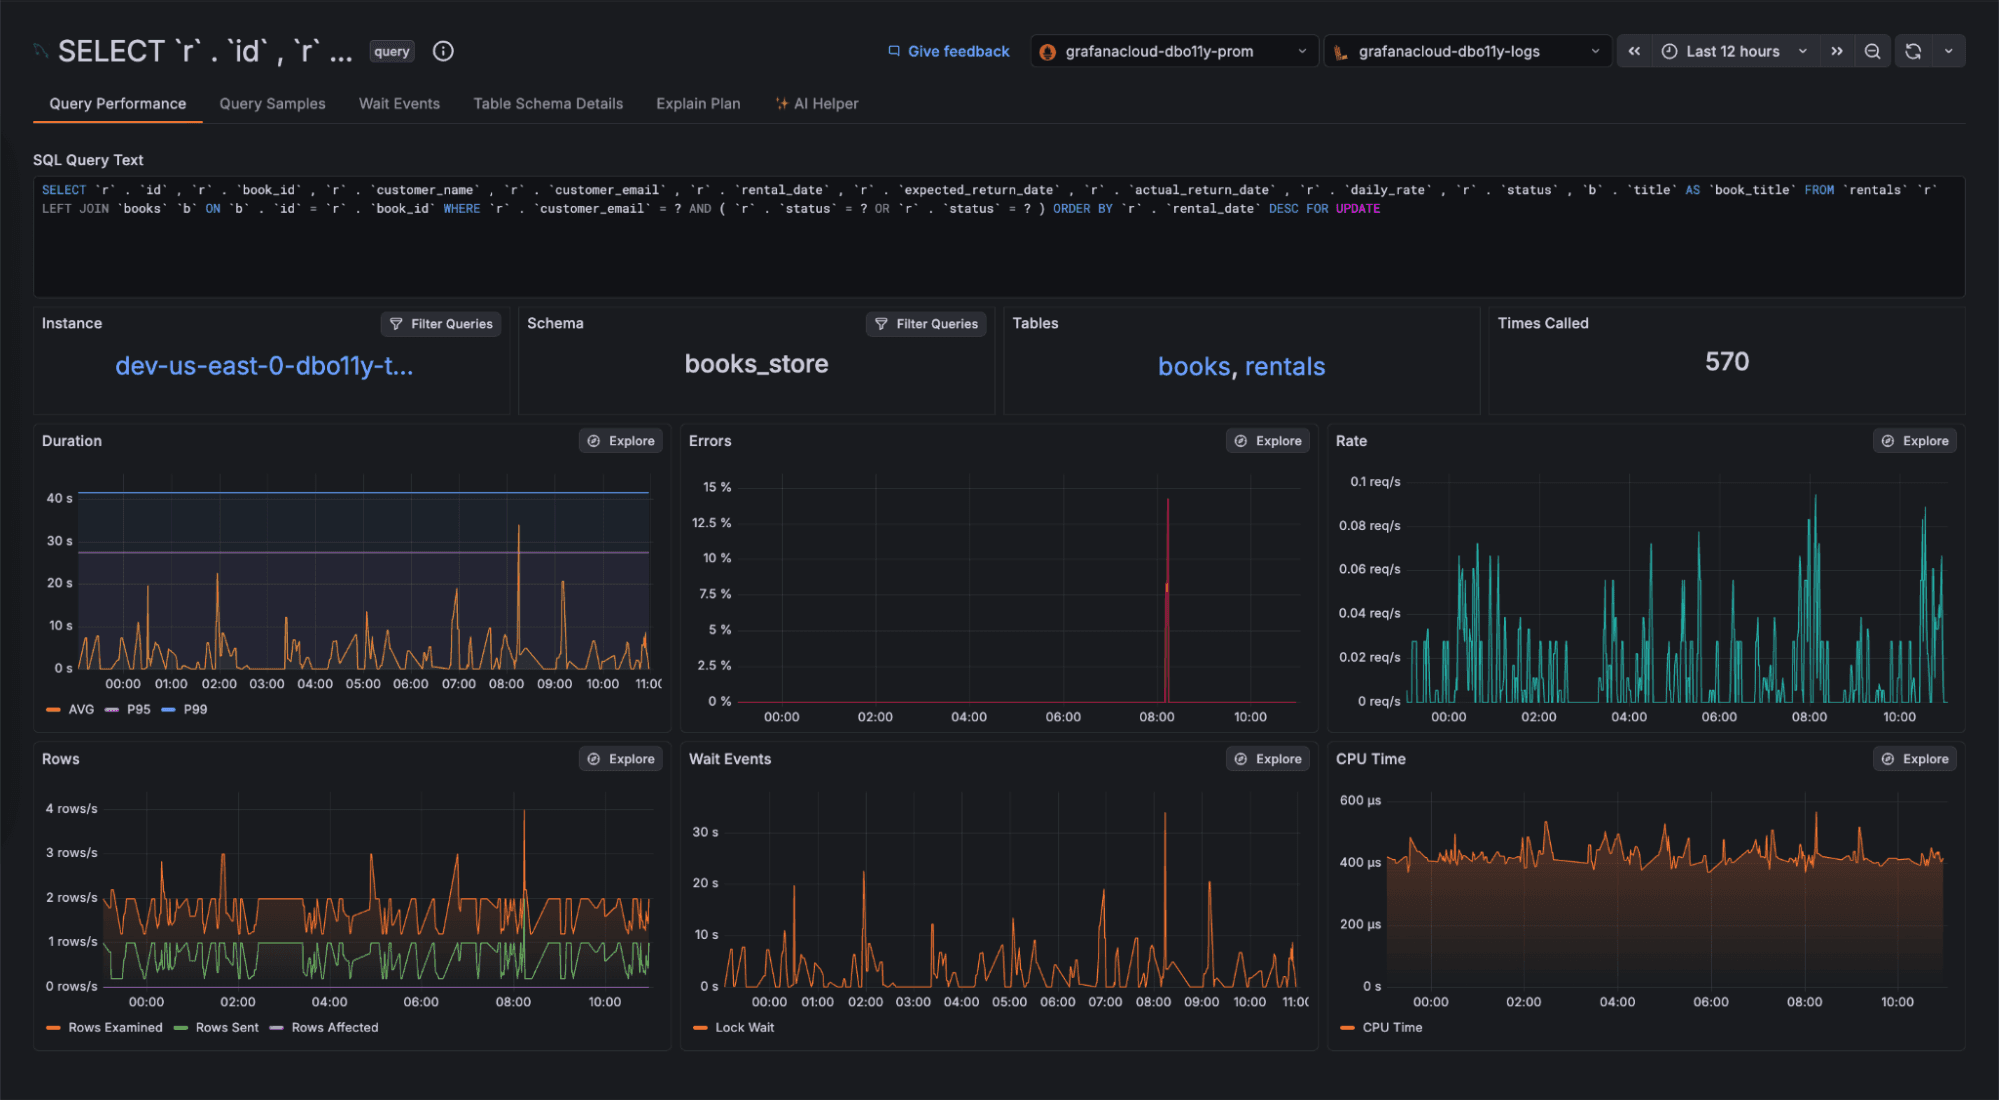
Get at a glance performance trends across key metrics, such as RED metrics, row counts, wait events, and CPU time spent executing the query.
Click on the "Tables" panel to navigate to the "Table Schema Details" tab. This view provides full schema information for the tables used in the respective query, providing additional context on what areas of your database the query touches. As a result, you can now spot missing constraints such as indexes and foreign keys as part of your typical Grafana Cloud workflows—no context switching needed.

To further understand the execution of your query, and how it makes use of your schema, navigate to the "Explain Plan" page, which renders a graphical representation of the execution plan for your query. By viewing all operations that take place, along with their respective cost to the total query duration, you can understand how your query is executed and where there is opportunity for improvements in how the query and schema are configured.

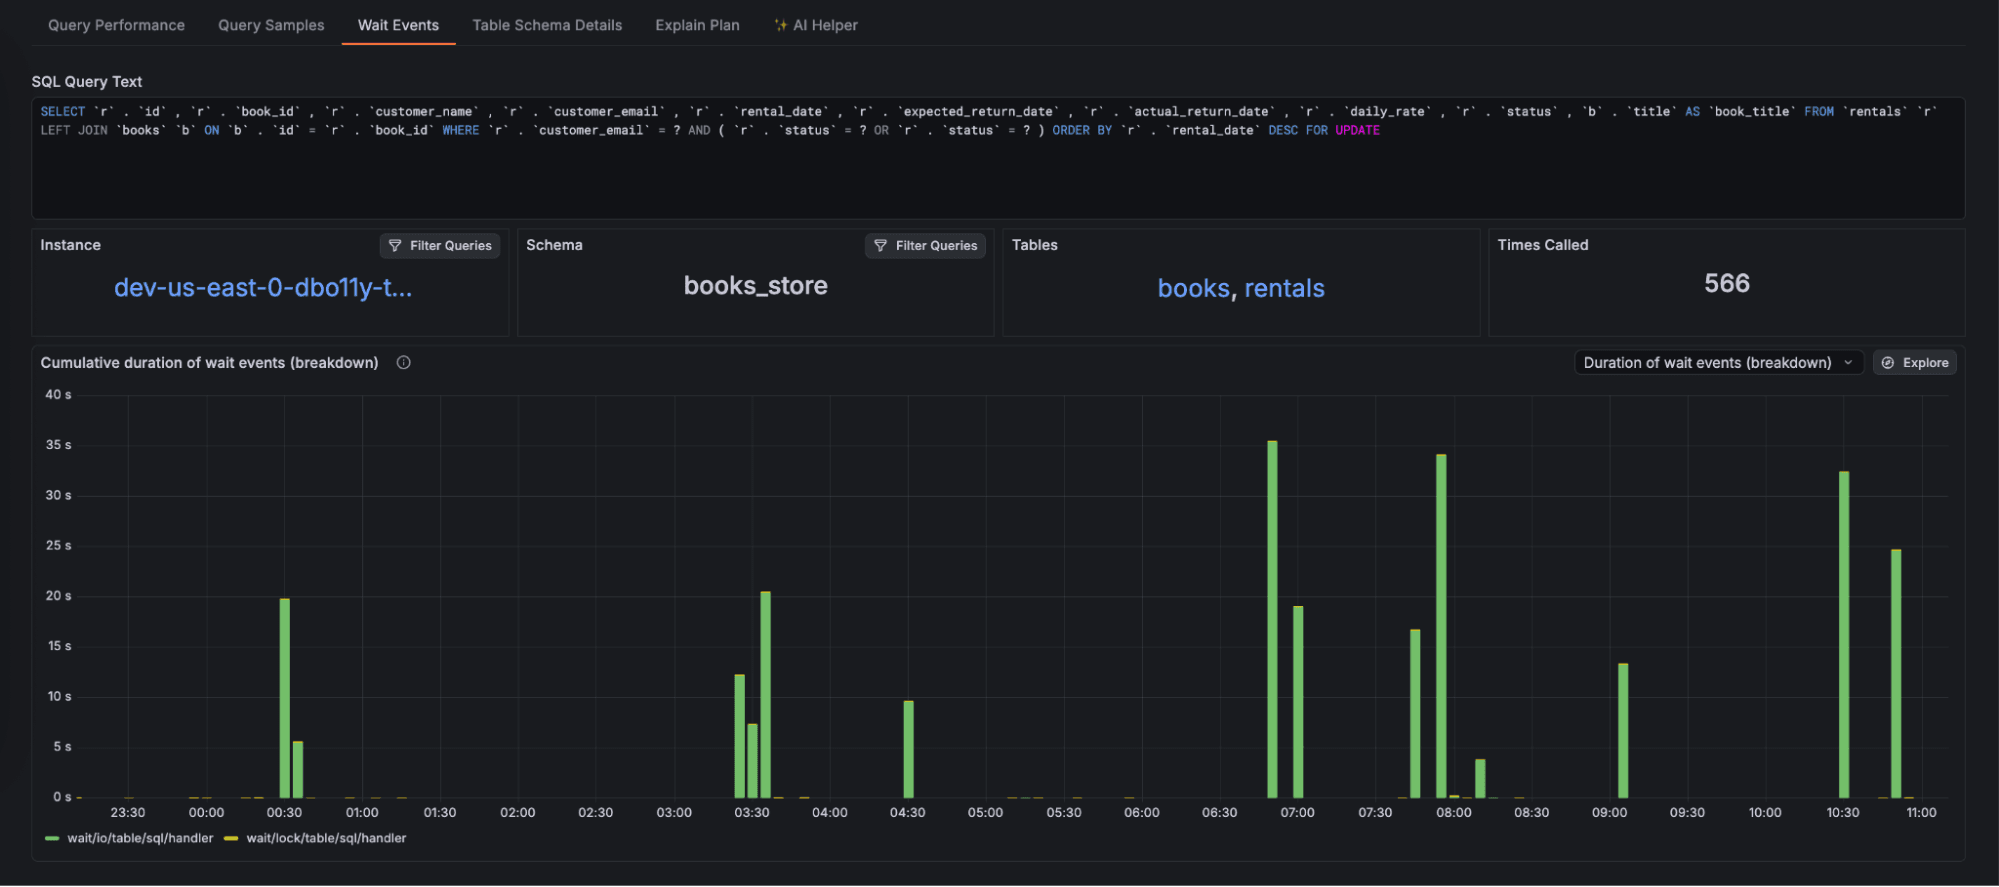
Check out the wait events that are holding up your query to understand the impact lock and wait events happening across the database are having. By examining these wait event patterns, you can spot contention issues that require intervention.
View sampled executions of your queries to identify characteristics leading to specific performance patterns. Filter for specific samples such as those above latency thresholds, or errors in order to dive deeper into the behavior of problematic executions.

Additionally, query samples let you capture trace information as part of query execution, enabling you to grasp a full end-to-end trace view of a request through your system all the way down to the DB query.

Leverage AI to optimize your queries
Finally, make use of AI expertise to help you further understand your query behavior, and take steps to optimize performance. The "AI Helper" tab makes use of all the data mentioned above, providing the LLM with a wealth of contextual information to help it provide useful and actionable next steps to improve your query. You'll also be presented with relevant code snippets and documentation.

With these features provided by Database Observability, understanding your SQL queries and their relationship with application and infrastructure metrics is easier than ever. Investigate, diagnose and optimize queries all within Grafana.
We’re excited for you to give Database Observability a try, so let us know how it helps you unlock new observability journeys.
Get started with Database Observability today
Setting up Database Observability can be done in a few quick steps:
1. Ensure that your MySQL or PostgreSQL database is enabled to support introspection and telemetry collection. This step enables the data to be exposed so it can be collected and shipped to Grafana Cloud later.
2. Create a new database user for the purpose of Database Observability. This user will be used in Step 3, and follows the practice of least privilege to grant only the required permissions for telemetry collection.
3. Run Grafana Alloy, our open source telemetry collector, with the respective components for your database engine, which will leverage the user created in Step 2 to collect the data made available in Step 1. From there, telemetry will be pushed to Grafana Cloud to power the Database Observability app to enable you to explore your queries!
For more information on the above steps, be sure to check out the Database Observability documentation that describes the process for each step in greater detail.
Grafana Cloud is the easiest way to get started with metrics, logs, traces, dashboards, and more. We have a generous forever-free tier and plans for every use case. Sign up for free now!

