

Faster, more collaborative data exploration: Introducing saved queries in Grafana Cloud
Writing queries is one of Grafana's most powerful features, but it can also be one of the most time-consuming. Whether you're exploring logs or building new dashboards, you often find yourself and your team rewriting the same queries over and over again.
This is why we rolled out saved queries, a feature that makes it easy for everyone on your team to save, share, and reuse queries, eliminating the need to start from scratch each time. This helps new team members get up to speed faster, and allows your entire organization to benefit from consistent, well-crafted queries that reflect shared best practices.
Read on to learn how to get started with saved queries in Grafana Cloud, and check out a demo of the feature in the video below.

Why we built saved queries
For growing engineering teams, scalability is key to success. When working with Grafana Cloud, practices like metric standardization and reusable query components play a crucial role in helping teams efficiently scale their observability strategies.
Through conversations with our users, we noticed how they share knowledge across different stages of their observability workflows — from building dashboards to creating alert rules and troubleshooting issues. A common theme emerged: users wanted an easier way to reuse queries directly in Grafana Explore, without having to rewrite them from scratch or hunt for the right dashboard. Explore is often the natural entry point for users investigating logs or metrics, so this friction slowed them down.
Another recurring challenge has been onboarding new team members to Grafana Cloud. In many organizations, query knowledge is concentrated among early adopters or admins. Some teams have tried to bridge this gap by manually maintaining collections of reusable queries, but this approach didn’t scale.
We built saved queries to address these needs, and help teams capture, share, and reuse knowledge seamlessly, so they can get value from Grafana Cloud faster and at scale. Here’s a closer look at some of the key benefits and use cases.
Standardize observability methodologies
Teams often rely on well-known frameworks like RED (Rate, Errors, Duration) or USE (Utilization, Saturation, Errors) to monitor system health. With saved queries, you can lock in consistent definitions for these key metrics across all your dashboards and alerts.
For example, you could save a consistent set of RED queries for all services, such as:
rate(http_requests_total[5m])for request raterate(http_requests_errors_total[5m])for error ratehistogram_quantile(0.95, sum(rate(http_request_duration_seconds_bucket[5m])) by (le))for latency
Infrastructure teams relying on the USE method could save baseline queries for node or container metrics for more consistent resource analysis.
Build dashboards faster
Traditionally, building a Grafana dashboard has typically meant writing a new query for each panel. Now, with saved queries, you can pull from a library of reusable queries and quickly populate panels so you spend more time visualizing data and less time writing code.
For example, teams can create a "baseline query library" for metrics like request throughput, error counts, or cache hit ratio. When creating dashboards, users can simply pick from these trusted queries. Performance teams can also curate a list of "approved queries" that standardize how latency, availability, or resource usage are calculated across teams, reducing mismatched definitions.
Improve onboarding and knowledge sharing
Not everyone is an expert in query languages. For example, teams writing Grafana Loki queries in Explore often have to write complex LogQL expressions involving labels, regex filters, and rate functions.
With saved queries, power users can save their well-tested LogQL queries, such as those for error rate per service or slow request logs, so others can reuse them without needing to learn LogQL as deeply.
This kind of knowledge sharing can also benefit troubleshooting workflows. When an incident occurs, responders can simply open Explore and reuse saved queries from past investigations to speed up response time.
Manage annotations
In Grafana, annotations are a way to indicate certain events, including deployments, feature releases, or incident start/end times, within your visualizations. With saved queries, annotations become easier to manage and reuse.
Instead of manually recreating annotation queries on every dashboard, teams can save a single query — for example, a Loki LogQL expression like {app="frontend", message=~"Deployment.*completed"} to mark deployments, or a PromQL query that pulls incident timestamps from metrics — and reuse it across dashboards. This ensures consistent event overlays such as deploys, outages, or config changes, while simplifying setup for non-experts and reducing maintenance overhead.
Reduce costly mistakes
Accidentally writing an expensive or inefficient query can slow things down and impact the bottom line. Saved queries allows query language experts to provide trusted, optimized queries that others can safely reuse. This reduces risk and helps teams maintain consistent query performance across dashboards and Explore sessions.
Get started with saved queries
There are two main ways to interact with the saved queries feature: saving a query, or using a saved query.
How to save a query
When you create a query in the query editor that you want to save, click Save query.

This opens the saved queries drawer, where you can enter a title, optional description, and tags for your query.
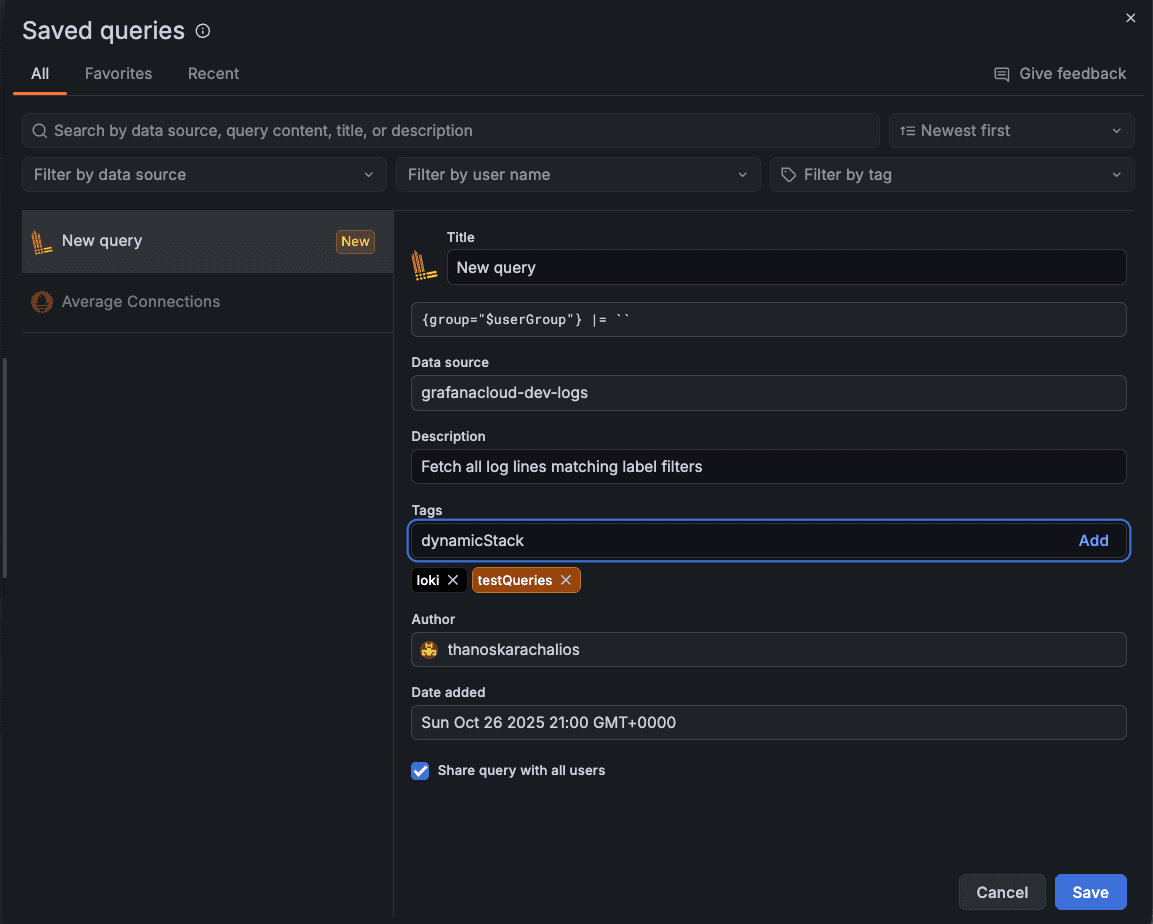
Tags and a detailed description are helpful to group queries based on meaningful themes for your organization. This makes it easy for others to find queries that are relevant to them via a searchable list.
You can also choose between two visibility options for your query:
- Private: This is the default setting, and means the query will only be visible to you.
- Shared: Use this setting when you want to make the query visible to other users across your organization.
How to use a saved a query
To access other queries that your teammates have saved, click + Add from saved queries in the query editor.
This, again, will open the saved queries drawer, where you can search and filter queries by data source, author, or tags.

Note that when you add a saved query to a panel or Explore, the query content is automatically copied in; if the author of that query eventually makes edits to it, you’ll need to re-add the query.
You can also create a list of queries you refer back to most often, and quickly find them in the Favorites tab.
Wrapping up
Saved queries is available in public preview today for all Grafana Cloud users, and can also be enabled in Grafana Enterprise via the queryLibrary feature toggle. To learn more about how to save, share, and manage your queries, please check out our documentation.
Looking ahead, we’re exploring ways to make saved queries even more powerful, including enhanced support for parametrized queries, support for alert rules, and the ability to store queries by reference, so a single change can automatically update every dashboard that uses it.
In the meantime, we’d love to hear your thoughts as you start using saved queries. Please fill out the feedback form in the saved queries drawer to share what you like and what we can improve. Your feedback will help shape the future of this feature!
Grafana Cloud is the easiest way to get started with metrics, logs, traces, dashboards, and more. We have a generous forever-free tier and plans for every use case. Sign up for free now!

