AI-powered observability: Resolve incidents faster, reduce alert fatigue, and expand access
When an incident lands in your lap, you'll often start with a lot of questions: Why is latency so high? What's causing this outage? How much money are we losing at this very moment?
The uncertainty—and the pressure to quickly find answers—has always been one of the more nerve wracking parts of being an on-call engineer, but it doesn't have to be that way any more. Instead of scrambling to make sense of all your observability data at once, simply take a deep breath, open Grafana Cloud, and ask Grafana Assistant: “What’s going on with my service and how could it impact revenue?”
Grafana Assistant, a context-aware AI agent built for Grafana, will take that request, launch an investigation that's tailored to your stack, and start exploring data for you—and with you. Whenever an investigation surfaces something new, the assistant will share the relevant context and point you to the right places in your stack so you can quickly get your service running properly again.
It's an exciting change in the way you can interact with your data in Grafana Cloud, and at ObservabilityCON 2025 we're thrilled to reveal the next step in that evolution, as we announce the general availability of Grafana Assistant and the public preview of Grafana Assistant Investigations, an AI-powered feature that extends Grafana Assistant to accelerate multi-step incident investigations.
Taken collectively, these tools will help you speed up root cause analysis, reduce alert fatigue, and make observability accessible to users at any skill level.
Get more from Assistant with our latest improvements
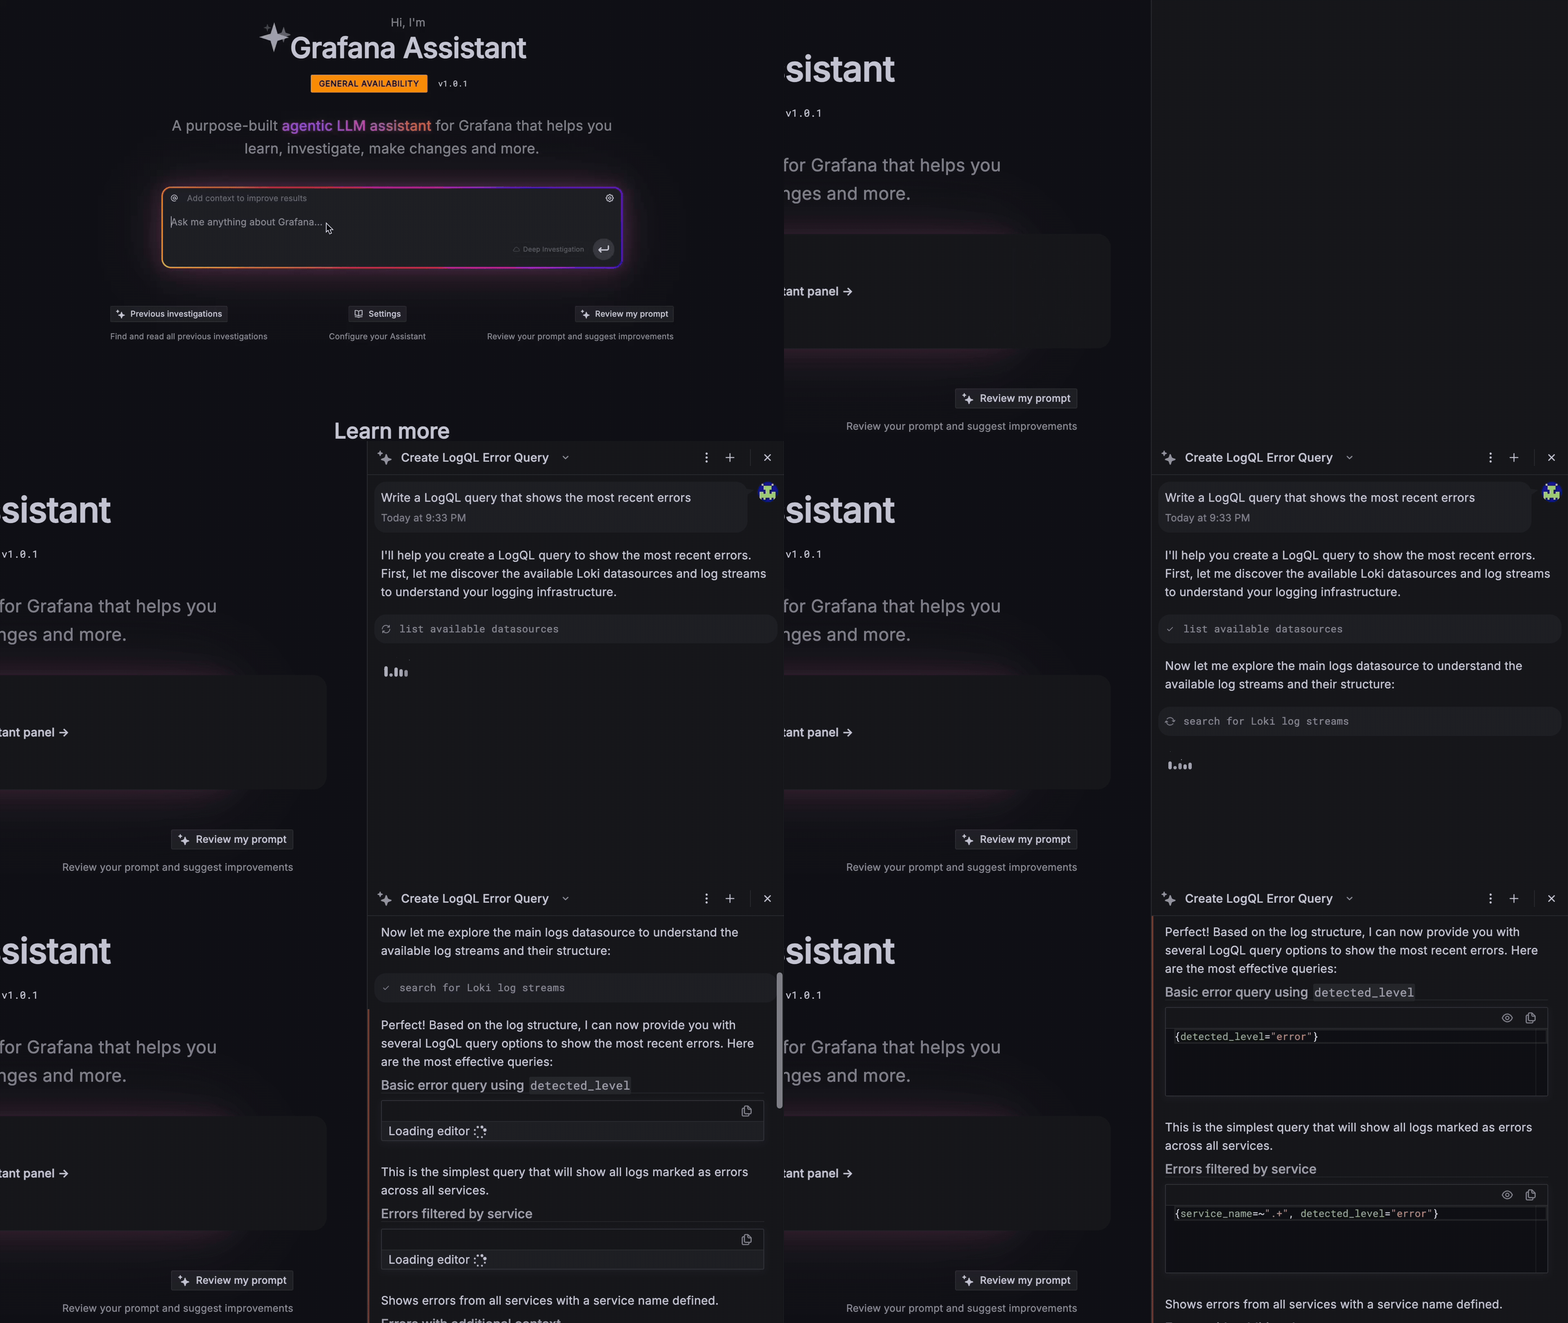
You can think of Assistant as an AI co-pilot for all your users. Embedded directly into the Grafana Cloud UI (simply click on the sparkle icon in the top-right corner to open the chat window), It helps you:
- Write and debug queries faster
- Build and optimize dashboards
- Investigate issues and anomalies
- Understand telemetry trends and patterns
- Navigate Grafana more intuitively, using natural language

We've seen a ton of excitement and engagement since we first announced Assistant at GrafanaCON 2025, and early users are already seeing measurable benefits.
“One of the biggest use cases for us is reducing the cognitive load on engineers,” said Neil Wilson, Director of Software Engineering, LexisNexis Risk Solutions. “Grafana Assistant helps us get to root cause faster—without needing deep expertise in every part of our complex system. That lowers training time and reduces risk if one of our experts leaves.”
And with the general availability release, we're pleased to share some additional enhancements:
- Profiles support: Assistant now supports all your telemetry signals, so you can analyze profiles and automatically generate and refine queries in PromQL, LogQL, and TraceQL based on plain-language prompts—no syntax knowledge required.
- In-product guides: We've added tutorials and built-in prompting guides to help you unlock value quickly and expand adoption. By giving non-observability teams self-service access, you can also reduce dependency on already stretched SREs.
- MCP server support: Connect to any remote MCP of your choice to bring in organizational knowledge and tooling. The assistant can then draw from that server and correlate the knowledge with your observability data.
- Enterprise-ready access controls: Building on existing RBAC in Grafana Cloud, Grafana Assistant now offers Assistant-specific roles and permissions. Admins can configure access to features such as rules, Assistant Investigations, and MCP server management at a granular level, ensuring teams can align observability workflows with enterprise security and compliance requirements.
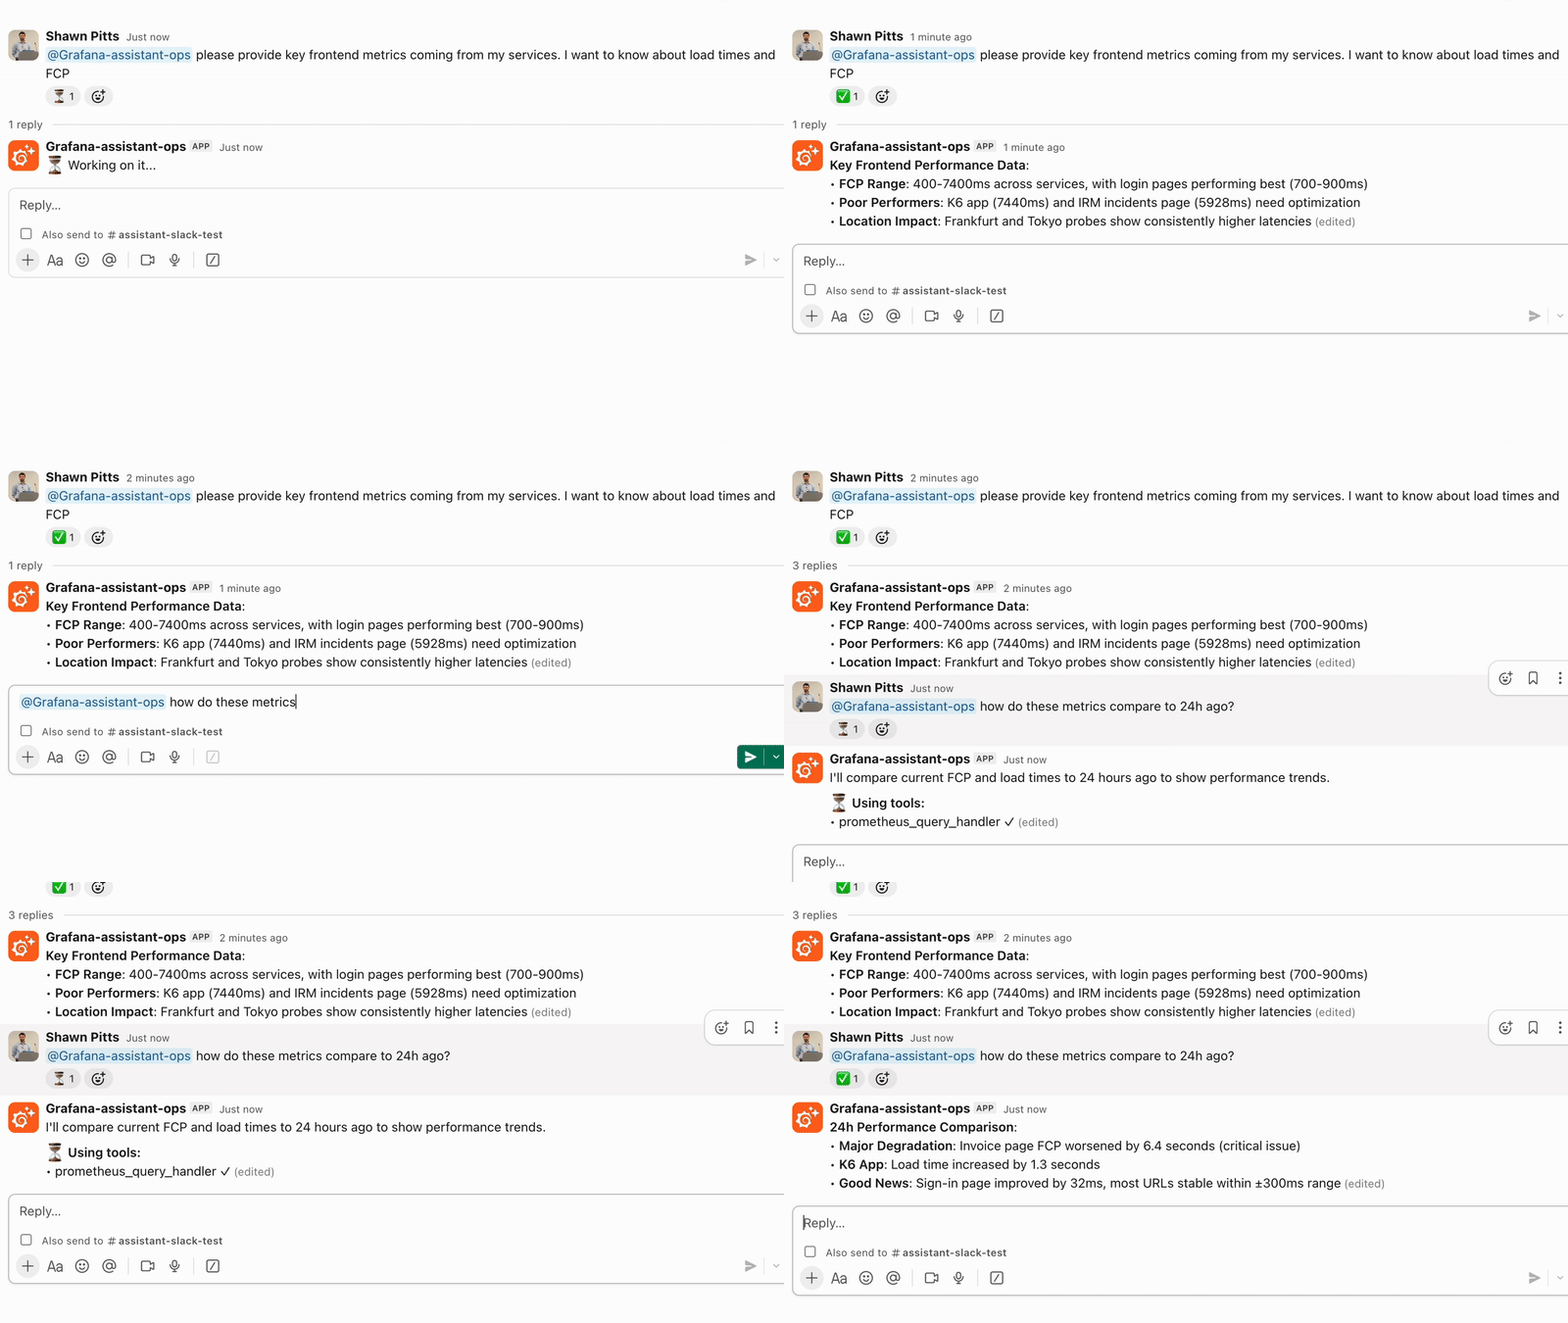
We're also excited to share the private preview of our Slack integration with Assistant (Sign up here for access.) Now you can take Assistant with you wherever you go. Plus, you can do most of the Assistant tasks directly in Slack—no context switching needed! Stay tuned for more on this soon.

Autonomous, multi-step incident investigations: Introducing Assistant Investigations
If Assistant is your AI co-pilot for finding answers in Grafana Cloud, you can think of Assistant Investigations as your support staff for narrowing down context during incidents.
Incidents can happen for all sorts of reasons. And if you're the one who's on call, one of your most important tasks is figuring out what isn't causing the problem. Chasing down all those leads and crossing off all your dead-ends is time consuming, but that's where Assistant Investigations comes in, as it can look at multiple possibilities all at once.
It coordinates specialized agents to analyze your observability stack, diving into your metrics, logs, traces, and profiles to find anomalies and build up a picture of your system. It will collect evidence in parallel, generate findings and hypotheses, then provide actionable recommendations for mitigation and remediation. And since it's embedded directly into Assistant, you get a seamless, guided workflow for resolving complex incidents.
You can ask Grafana Assistant at any time to pull in Assistant Investigations context and vice-versa. Found something that should be considered? Just tell the assistant to update your investigation.
The feature will roll out automatically to all Grafana Cloud customers that have access to Grafana Assistant.
How to get started with Assistant Investigations
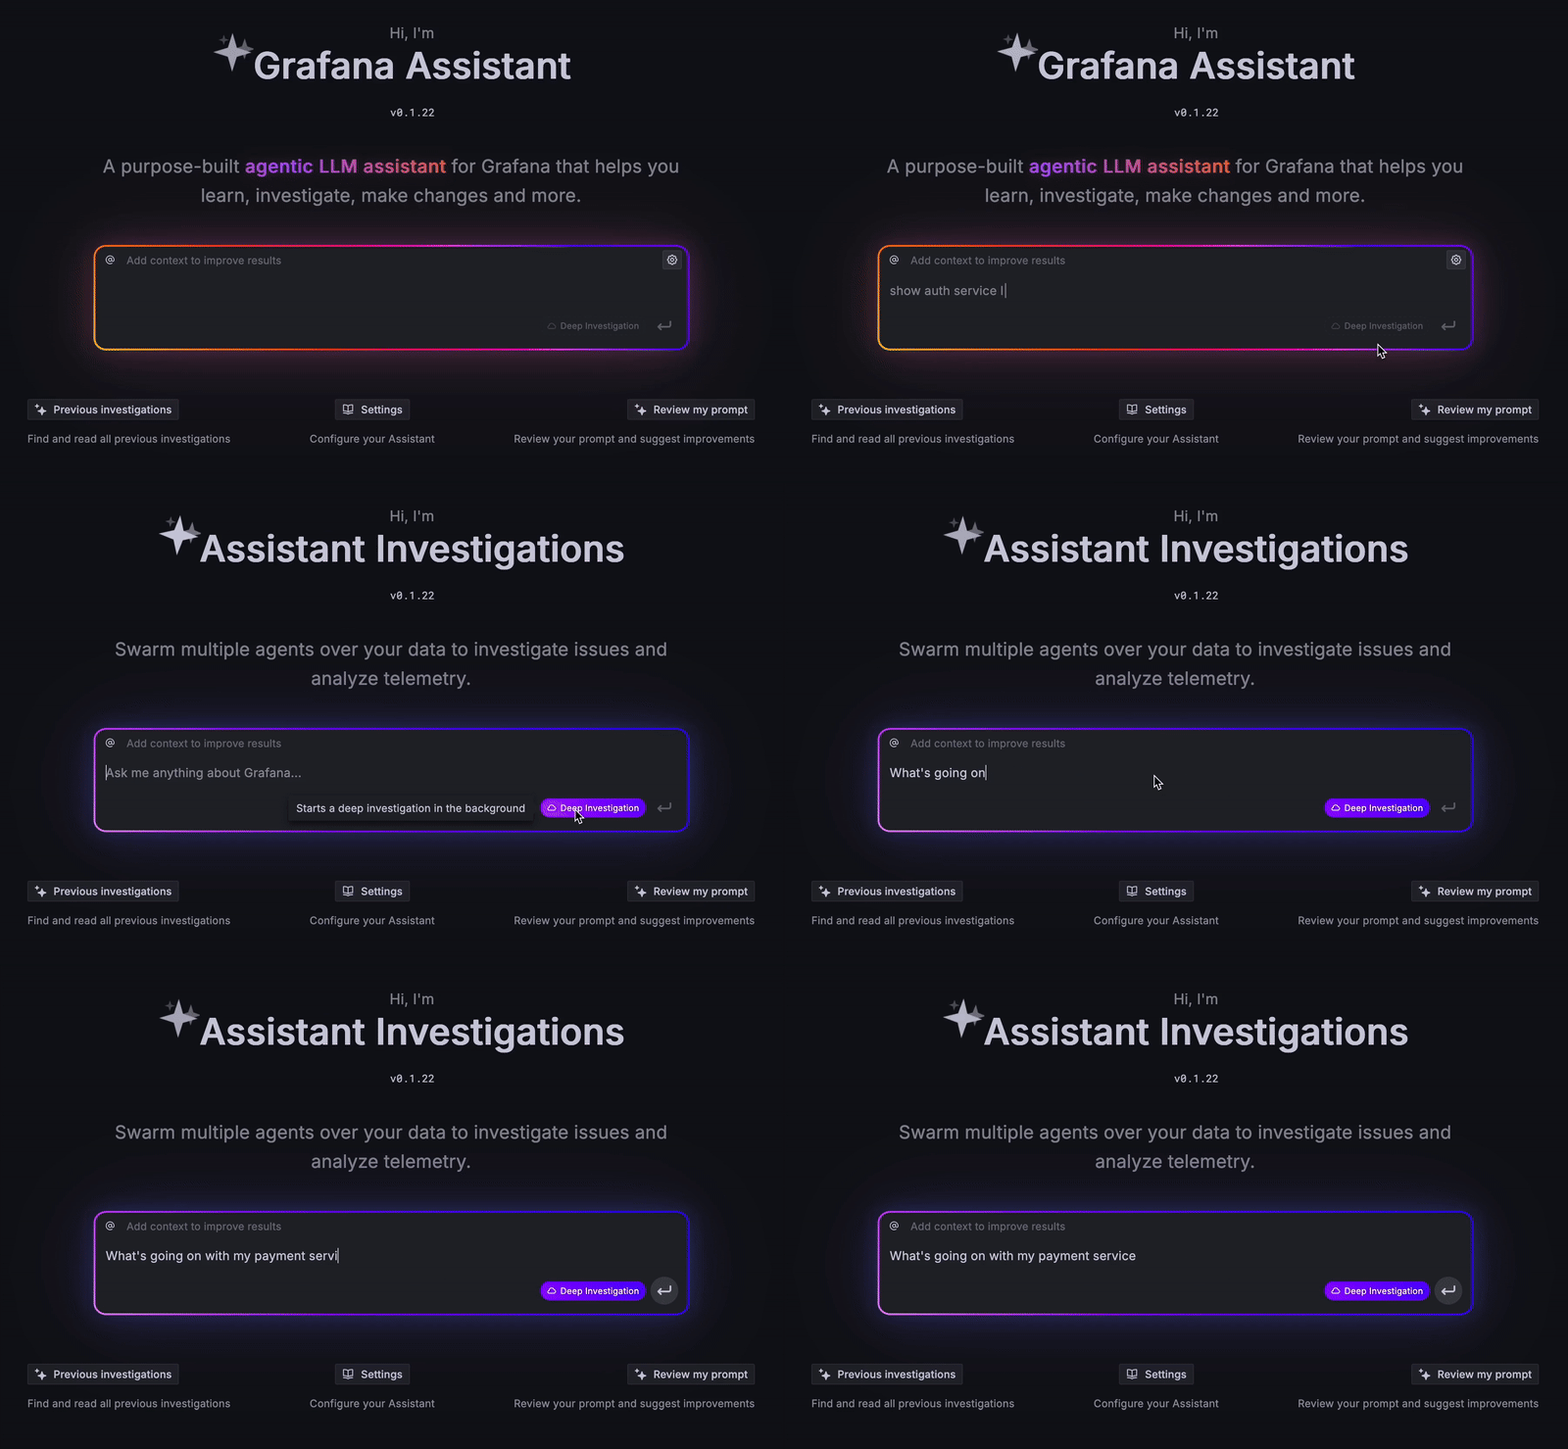
The next time you receive an alert, you can kick off an investigation from the chat window and our agents will start exploring your stack to uncover root causes, find correlations, and to guide you as you remedy the incident.
Getting started is simple: Hit the Deep Investigation button in Assistant and ask a question. For example: “Why do I have high latency in my payment service?” Assistant Investigations will then build a plan to investigate your problem; you can consult the progress at any time.

How we're building AI tooling differently at Grafana Labs
We realize this is a space with a lot of hype and some well-deserved hesitation. That's why it’s important to us that we build features that feel seamless and integrate well with what users do in Grafana. Bottom line: We want to make your observability journey simpler.
We're doing that by embedding AI directly into the heart of your observability workflows, redefining how your team interacts with its data. We've also designed these systems with the “human in the loop” concept in mind. Assistant and Assistant Investigations adapt to your input, learning from your cues to make each step more efficient and aligned with the way you work.
And we're not only developing this technology—we're using it internally. We get the struggles engineers face, because we face them, too. For example, we understand the need for flexibility, which is why we think our Slack and MCP server integrations will help you get work done faster, regardless of the time or your tooling. And we'll continue to build and improve AI-powered capabilities that can be tailored to fit your needs.
To learn more about our philosophy about building AI into observability, check out our recent blog post on the topic. And for more information on Assistant and Assistant Investigations, check out the corresponding docs.
To learn about all the news from ObservabilityCON 2025, check out our blog post recapping all the big announcements!
FAQ: Grafana Cloud AI & Assistant
What is Grafana Assistant?
Grafana Assistant is an AI-powered agent in Grafana Cloud that helps you query, build, and troubleshoot faster using natural language. It simplifies common workflows like writing PromQL, LogQL, or TraceQL queries, creating dashboards, and performing guided root cause analysis — all while keeping you in control. Learn more in our blog post.
What is Grafana Assistant Investigations?
Assistant investigations is an SRE agent built directly into Grafana Assistant. It helps you find root causes faster by analyzing your observability stack, uncovering anomalies, and connecting signals across your system. You get clear, guided recommendations for remediation — and because it’s embedded in Assistant, it provides a seamless, end-to-end workflow for resolving complex incidents.
How does Grafana Cloud use AI in observability?
Grafana Cloud’s AI features support engineers and operators throughout the observability lifecycle — from detection and triage to explanation and resolution. We focus on explainable, assistive AI that enhances your workflow.
What problems does Grafana Assistant solve?
Grafana Assistant helps reduce toil and improve productivity by enabling you to:
- Write and debug queries faster
- Build and optimize dashboards
- Investigate issues and anomalies with Assistant Investigations
- Understand telemetry trends and patterns
- Navigate Grafana more intuitively
What is Grafana Labs' approach to building AI into observability?
We build around:
- Human-in-the-loop interaction for trust and transparency
- Outcome-first experiences that focus on real user value
- Multi-signal support, including correlating data across metrics, logs, traces, and profiles
Does Grafana OSS have AI capabilities?
By default, Grafana OSS doesn’t include built-in AI features found in Grafana Cloud, but you can enable AI-powered workflows using the LLM app plugin. This open source plugin connects to providers like OpenAI or Azure OpenAI securely, allowing you to generate queries, explore dashboards, and interact with Grafana using natural language. It also provides a MCP (Model Context Protocol) server, which allows you to grant your favourite AI application access to your Grafana instance.
Why isn’t Assistant open source?
Grafana Assistant runs in Grafana Cloud to support enterprise needs and manage infrastructure at scale. We’re committed to OSS and continue to invest heavily in it — including open sourcing tools like the LLM plugin and MCP server, so the community can build their own AI-powered experiences into Grafana OSS.
Does Grafana Cloud’s AI capabilities take actions on its own?
Today, we focus on human-in-the-loop workflows that keep engineers in control while reducing toil. But as AI systems mature and prove more reliable, some tasks may require less oversight. We're building a foundation that supports both: transparent, assistive AI now, with the flexibility to evolve into more autonomous capabilities where it makes sense.
Where can I learn more about Grafana’s AI strategy?
Check out our blog post to hear directly from our engineers.
What’s the difference between AI in observability and AI observability?
AI in observability applies AI to operate your systems better and refers to the use of AI as part of a larger observability strategy. This could include agents baked into a platform (e.g., Grafana Assistant in Grafana Cloud) or other integrations that help automate and accelerate the ways teams observe their systems.
AI observability is the use of observability to track the state of an AI system, such as an LLM-based application. It's a subset of observability focused on a specific use case, similar to database observability for databases or application observability for applications.
Grafana Cloud does both: AI that helps you operate, and observability for your AI.
Grafana Cloud is the easiest way to get started with metrics, logs, traces, dashboards, and more. We have a generous forever-free tier and plans for every use case. Sign up for free now!


