

The observability maturity curve: How IT leaders are shifting from tools to outcomes
Observability has come a long way from its origins in monitoring logs and metrics. Today, it sits on a maturity curve: Organizations move from fragmented tool stacks to unified platforms to proactive engineering practices that tie reliability to business outcomes.
To better understand where IT leaders are on this curve, Grafana Labs surveyed 150 decision-makers across industries in advance of ObservabilityCON 2025. The findings reveal a true progression:
- Teams are starting with unified platforms,
- Wrestling with consolidation,
- Adopting SLOs for accountability,
- Experimenting with AI-assisted insights,
- And increasingly tying observability to business value.
Taken together, these milestones map out a key trend that shows not just where the industry is—but where it’s headed.
1. We’re entering the era of unified observability
Nearly three-quarters of executives have either implemented (44%) or are actively transitioning to (29%) unified observability platforms. Only a small fraction (3%) reported having no defined strategy.
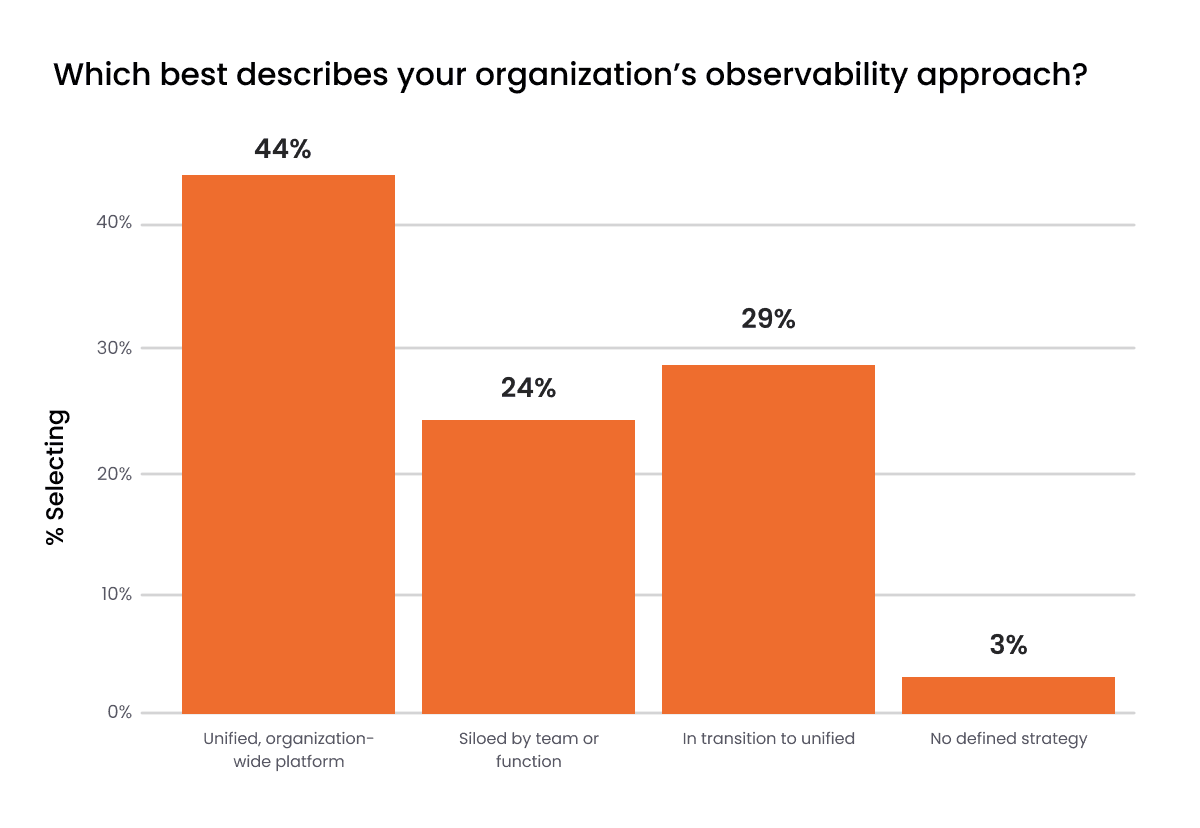
This marks the starting point on the maturity curve: breaking down silos. Whether it's for faster incident resolution or better developer experience, unified observability is no longer a "nice to have"—it's the foundation of modern operations.
Our take: Vendor-neutral platforms like Grafana Cloud are poised to lead this shift. As organizations unify tools and data sources, open and composable ecosystems offer the flexibility enterprises need without lock-in—a foundational move for scaling maturity.
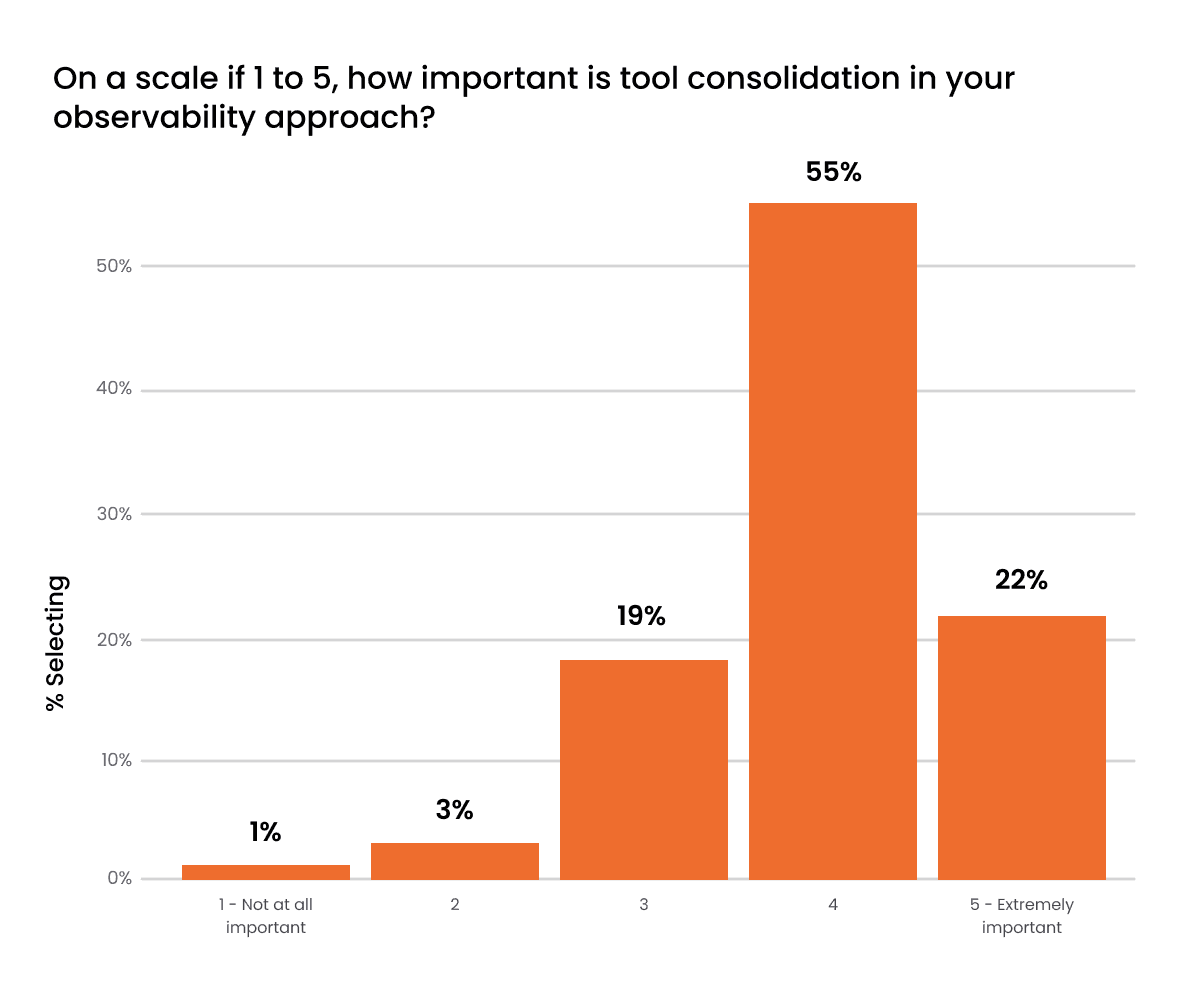
2. Tool consolidation is a strategic priority, but still a work in progress
Yes, most executives are in agreement that unified observability is the best path forward, but their ability to execute and get value from that consolidation remains a work in progress. For example, 77% of respondents rated tool consolidation as important, but only 14% consider their consolidation efforts very successful. Two-thirds are somewhere in the middle: on the journey but not yet at the destination.
This reflects the growing pains of the maturity curve. Merging complex telemetry pipelines while supporting multiple teams and legacy systems isn’t trivial. Yet the momentum is there, and both cost pressures and operational clarity are driving it.
Our take: This is an opportunity for observability platforms to offer more out-of-the-box integrations, intelligent defaults, and better UX to reduce the cost of context switching and tool overload. The platforms that win will be open and composable, giving organizations the flexibility to unify tools at their own pace while avoiding lock-in.
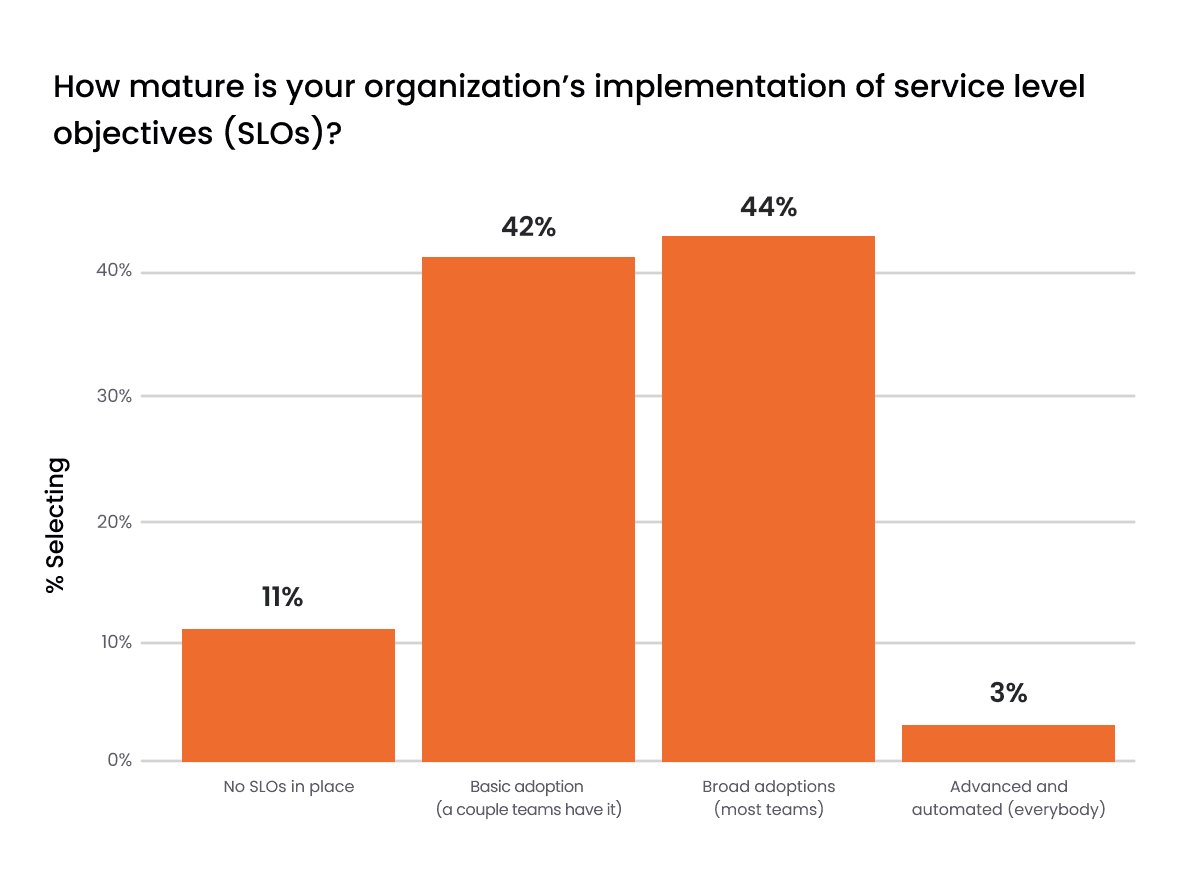
3. SLOs are changing the way teams work, even if they’re not fully mature
Service level objectives (SLOs) are internal reliability targets like uptime and latency, which are quickly becoming a standard practice. 86% of organizations reported "basic" or "broad" adoption of SLOs, mainly to track service level agreements (SLAs), alerting, and leadership reporting. While SLO adoption is growing, only a little over a third (39%) use SLOs to prioritize engineering work, which points to the fact that many organizations are still in the early stages of maturity, using SLOs for reactive reporting rather than as a proactive driver of engineering priorities.
This stage represents the maturing middle of the curve: moving from visibility to accountability. Still, teams that have embraced SLOs report real impact; 56% said SLOs significantly changed how they operate, particularly in accountability, visibility, and data-driven decision-making.
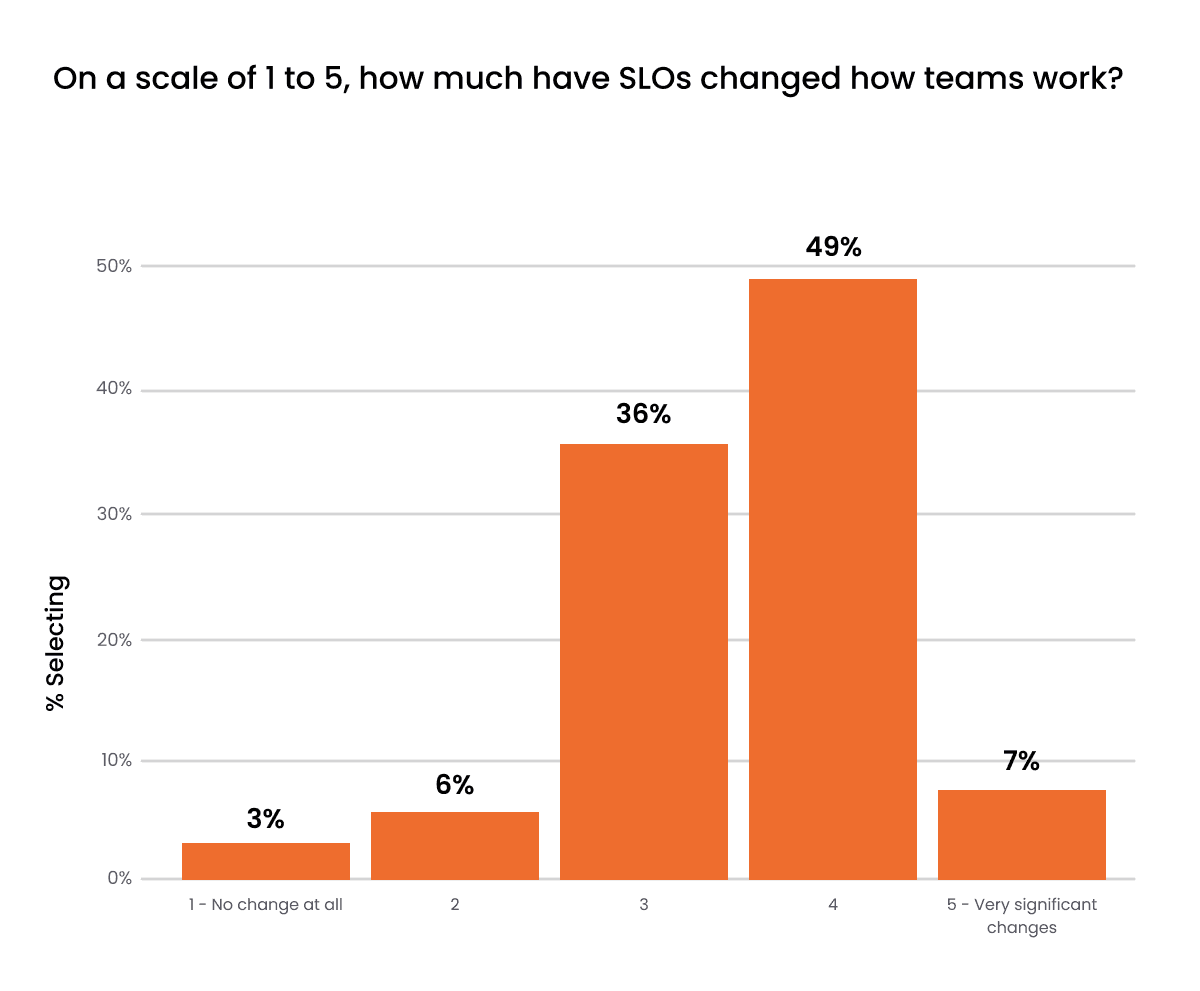
“We're a data-centric company. SLOs allow us to hold people accountable with data. It also points to performance directly. It helps change the culture to more of a results-oriented one.” – C-level executive at a midsized consulting firm on the benefits of SLOs
Our take: SLOs are the bridge between technical reliability and business alignment. But they need to be actionable—not just a set of unattended goals highlighted on a dashboard. We see a future where AI-powered SLO insights help teams shift from reactive firefighting to proactive engineering.
4. AI in observability is on everyone’s radar, but it's still early
As organizations mature their observability strategies, many are looking beyond dashboards and alerts to the next frontier: AI.
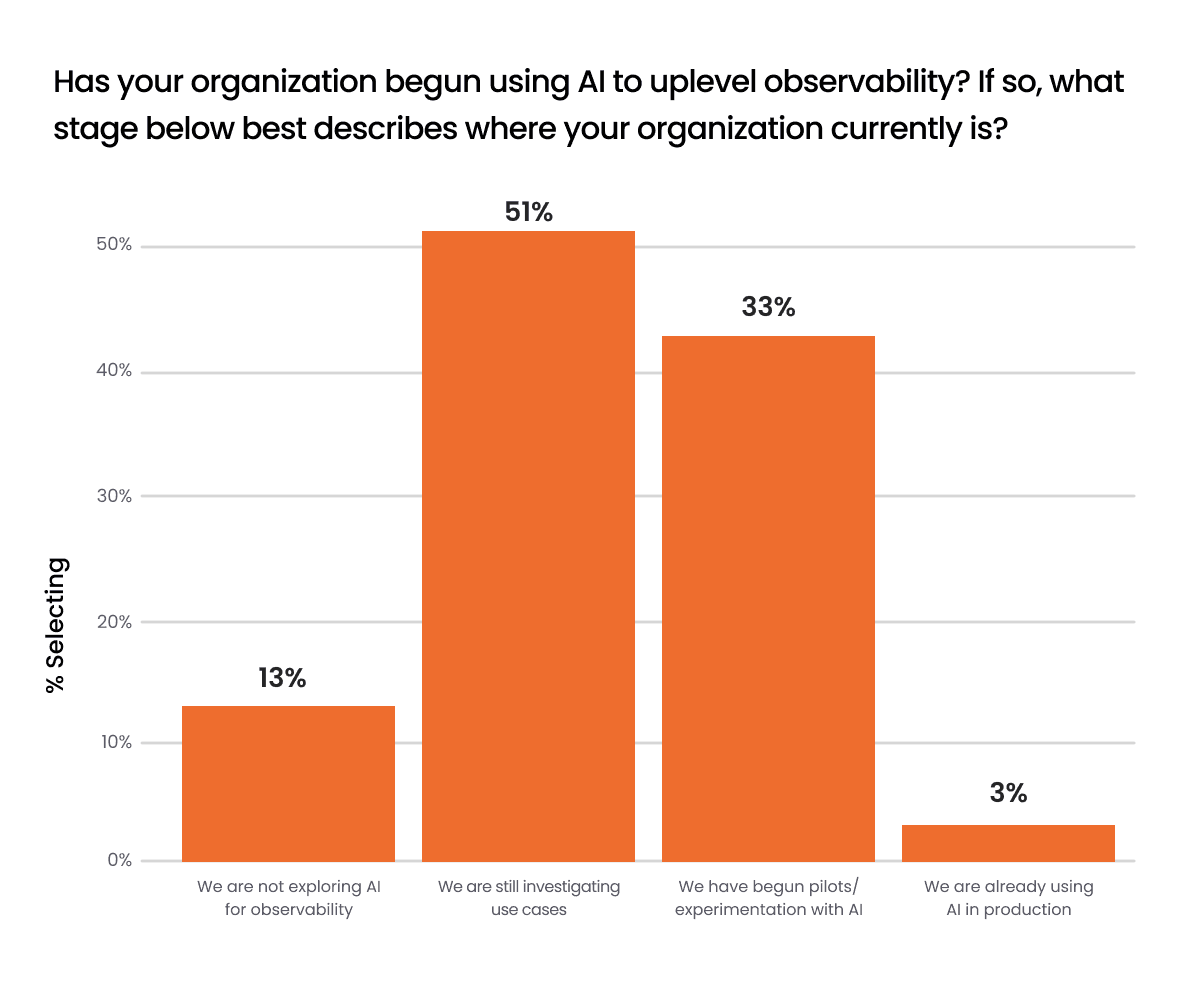
So far, only 3% of organizations have deployed AI for observability in production to help reduce alert fatigue, detect anomalies earlier, and guide incident response. However, more than 80% are actively exploring or piloting use cases. Most prefer to purchase rather than build solutions, and voluntary experimentation drives adoption.
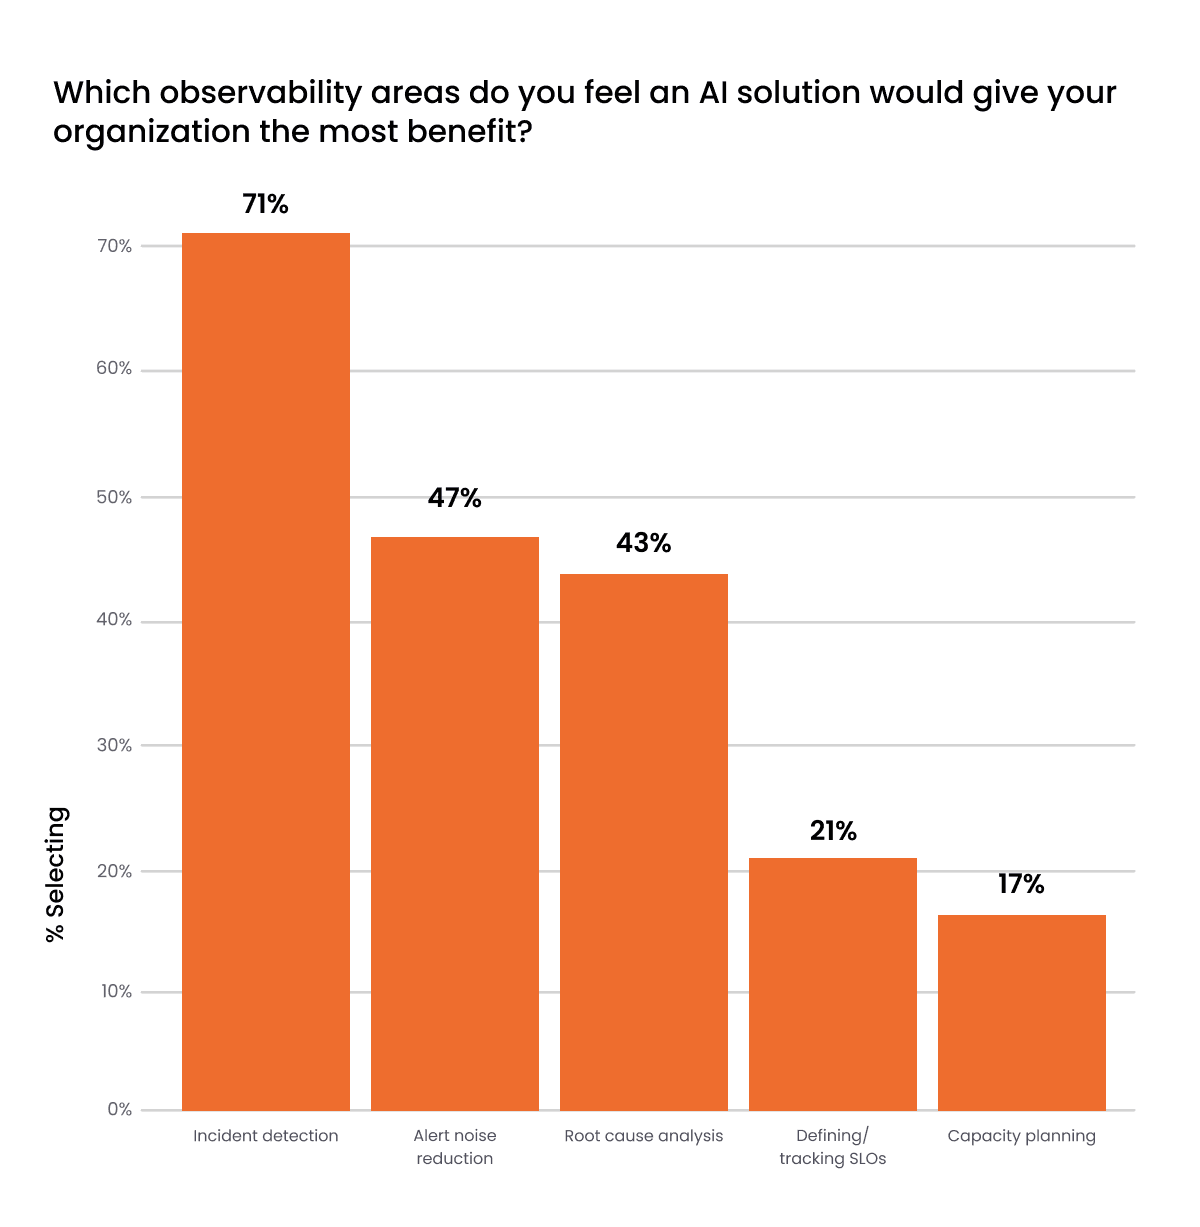
Top use cases? Incident detection, reducing alert fatigue, root cause analysis, and SLO tracking. But notably, root cause analysis ranked lower—perhaps a sign that teams still trust human intuition for postmortems, or that the state of the art has not yet reached the point where it can be trusted—at least not yet.
This is the cutting edge of the maturity curve: using AI not to replace human intuition but to amplify it.
Our take: The next wave of observability won’t just surface more data, it will help teams understand what matters. At Grafana Labs, we believe AI should act as a co-pilot, not a black box. That’s why our approach to AI-assisted observability prioritizes transparency, explainability, and user control.
5. The end goal: measurable business impact
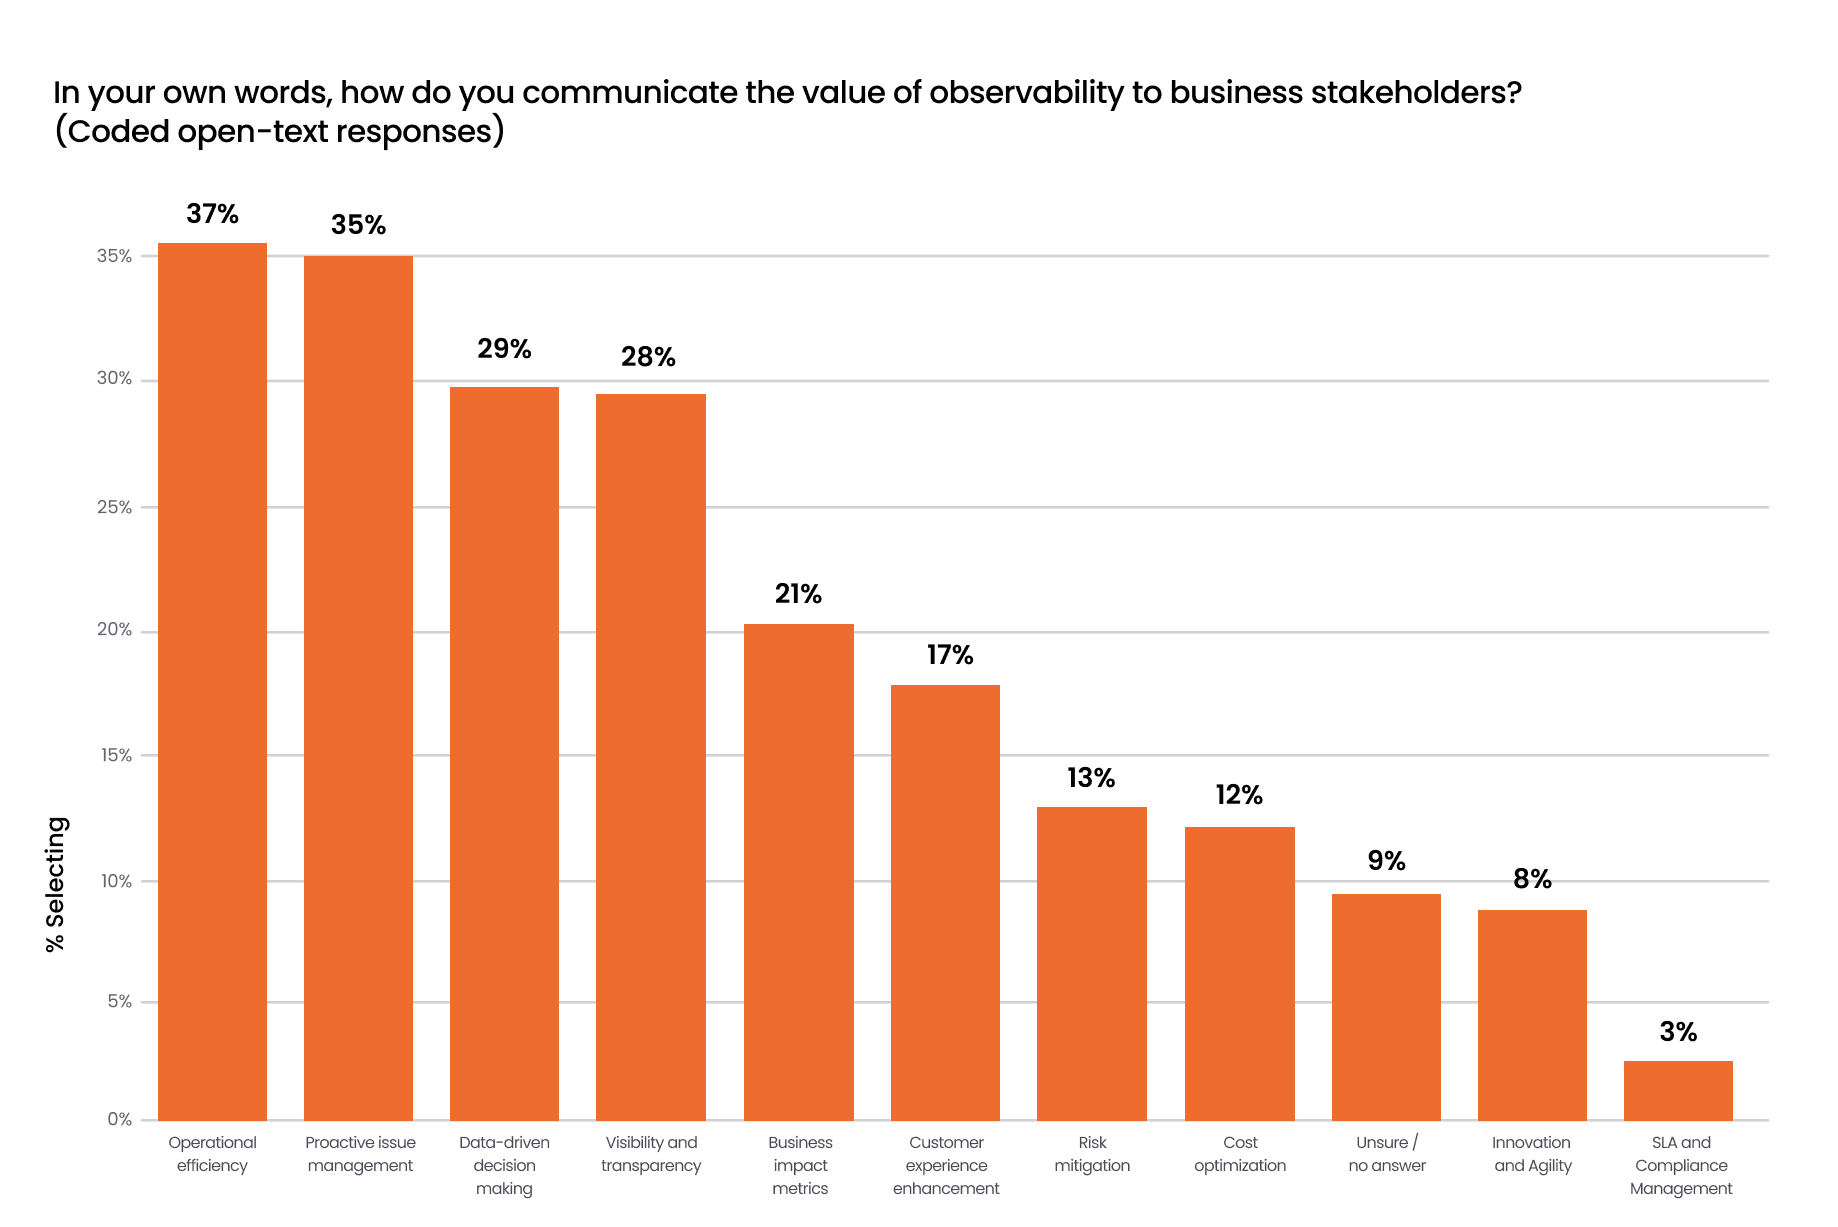
Only 14% of respondents quantify observability ROI in financial terms. Most use operational metrics like uptime, incident frequency, and mean time to resolution. And while business leaders increasingly rely on observability for proactive issue management and strategic decisions, cost optimization ranked surprisingly low.
“We look at how observability helps reduce MTTD and MTTR incidents. Shorter detection and resolution times mean less downtime, fewer service disruptions, and more consistent user satisfaction. That’s a clear sign of value, even if we’re not attaching a price tag to it.” – C-level executive at a consulting firm on how they assign value to observability outcomes without a specific dollar value
This is the summit of the maturity curve: when observability becomes a business driver, not just an engineering tool.
Our take: Teams are underselling the impact of observability because of that gap between the real value observability delivers and the way it’s currently measured. As observability matures, we expect more teams to tie performance to business outcomes such as customer experience, developer productivity, or revenue protection. Eventually, observability will be seen as more than just an operational tool and become a strategic business driver.
Observability’s next chapter
The survey confirms what we see every day at Grafana Labs: Observability is no longer just the purview of infrastructure teams; it's critical to the success of data-driven businesses. With 41% of organizations increasing observability spending in the past year and 55% expecting to invest even more in the year ahead, the message is clear: the value of observability is only growing.
But unlocking that value means progressing along the maturity curve. It starts with unifying platforms, advances through tool consolidation and disciplined SLO practices, and looks ahead to AI-assisted insights and measurable business impact.
That’s the future we’re building toward. Whether you’re consolidating tools, scaling SLOs, or experimenting with AI, Grafana Labs is helping turn data into insight—and insight into impact.
Methodology
This research was conducted in partnership with market research firm Enterprise Technology Research, which surveyed 150 IT decision-makers from around the world for this study. The survey took place in July 2025. Respondents spanned multiple industries, including financial services, healthcare, IT, manufacturing, education, retail, government, and more. To qualify, all respondents had to be at the Director level or above and have responsibility and visibility into their organization’s observability and monitoring practices, as well as a high level of familiarity with the technology stacks used, related budgets, and purchasing decisions.
Grafana Cloud is the easiest way to get started with metrics, logs, traces, dashboards, and more. We have a generous forever-free tier and plans for every use case. Sign up for free now!
Last updated Oct. 6th 2025

