

How to perform real-time DNS monitoring in Grafana Cloud
When DNS or domain name server resolution processes fail, or become sluggish, users can experience timeouts, connection errors, and degraded performance — often without clear indication of the root cause.
This is where DNS checks in Grafana Cloud Synthetic Monitoring come in, allowing you proactively monitor domain name resolution, verify that domains resolve to the correct IP address, and even measure how quickly that resolution occurs. This helps you catch DNS issues before they lead to application failures, ensuring your users can reliably reach your services.
In this blog post, we’ll walk through how DNS checks work and show you how to create one using Grafana Cloud Synthetic Monitoring. You can also learn more by watching the video below.

What is a DNS check?
Synthetic Monitoring enables you to proactively monitor the performance of your applications and services from public and private probes located around the world. It allows you to set up a variety of checks, including ping checks, browser checks, scripted checks, TCP checks, and DNS checks.
DNS checks ensure that domain names resolve correctly to IP addresses and measure the average time for that resolution to occur. Behind the scenes, DNS checks work by sending automated requests to DNS servers and validating the results for specific domain names, checking that domains return the correct IP addresses in their A records, AAAA records, or other DNS record types.
When a DNS server doesn't respond or when a domain doesn't return the expected IP address, DNS checks in Grafana Cloud Synthetic Monitoring can immediately detect these issues and alert the appropriate team members. The key benefits of DNS check include:
- Real-time DNS monitoring: identify network performance responsiveness, latency, and availability from multiple global locations before they impact users
- Security monitoring: detect DDoS attacks or DNS poisoning attempts
- Global DNS validation: test DNS resolution from multiple locations worldwide for consistent performance
Run a DNS check
Let’s walk through setting up a DNS check in Grafana Cloud Synthetic Monitoring. This process involves a few key configuration steps.
1. Create a Grafana Cloud account
If you don’t already have one, sign up for a free Grafana Cloud account.
2. Navigate to Synthetic Monitoring
In the Grafana Cloud UI, go to Testing & synthetics to access tools for performance testing and optimization.


4. Add a request
Next, provide a Job name. We’ll use the name Example:DNS. For our request type, we’ll select DNS, and for request target, we’ll select grafana.com.

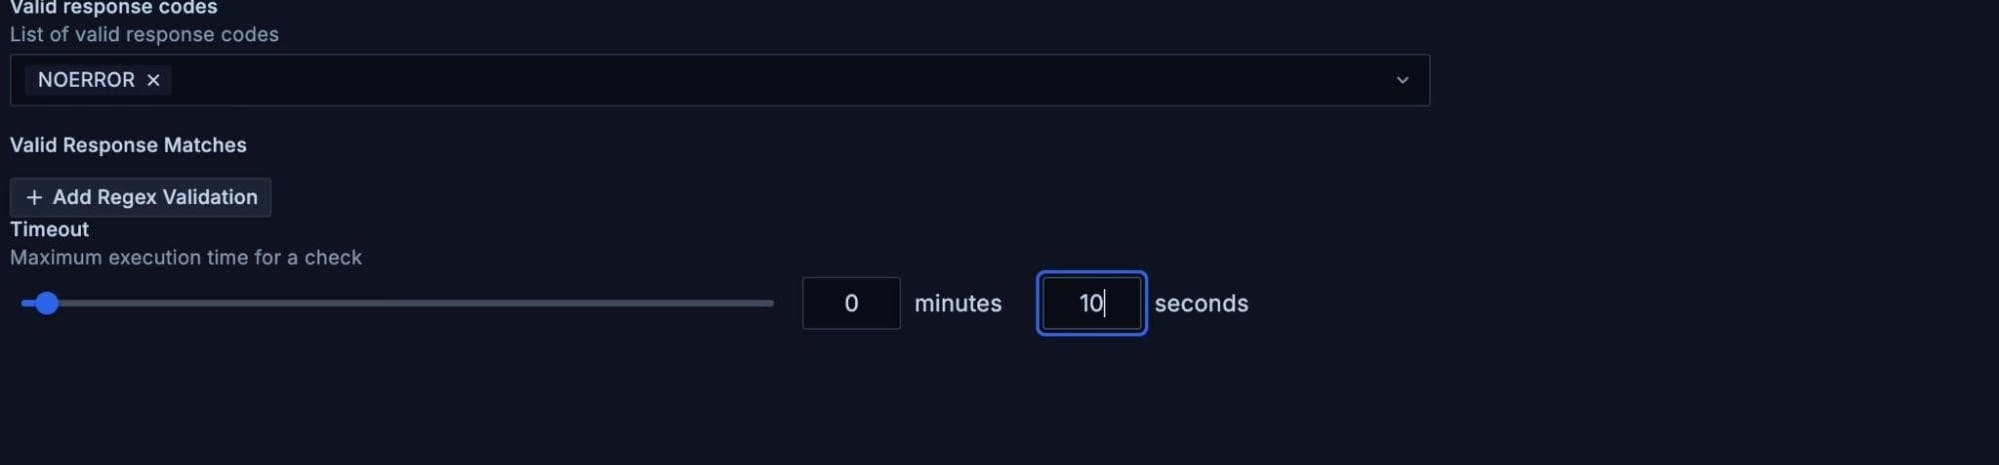
5. Set a timeout
With our DNS check added, we’ll specify the valid response code we are expecting. We’ll choose NOERROR, which means the DNS query got a valid response.
We’ll also specify the maximum execution time for this check. If the check takes longer than this period to run, the check will be marked as failed. For this example, we’ll choose 10 seconds.
6. Add labels
Labels help you organize and filter your checks. Adding a label makes it easier to segment results by environment or use case in the future. For this example, we’ll use the label env:test.

7. Choose a probe location
Grafana Cloud offers access to over 20 globally distributed probe locations. For this example, we’ll select Oregon, US and Singapore, SG. We advise that you choose the location closest to your users or infrastructure to best reflect their experience.


10. Save and run the check
Click Save to initiate the DNS check. Grafana Cloud will begin executing based on your configuration. You can also click the Test button to validate the check before saving.
Visualize the check results
After letting our DNS check run for a few hours, it’s time to review the results. Grafana Cloud Synthetic Monitoring provides a preconfigured dashboard for each check, giving you access to key insights. On this dashboard, you’ll find important metrics like uptime, reachability, average latency and frequency.

As you scroll through the dashboard, you’ll find additional charts that offer deeper visibility, including response latency by probe location and resource records for each probe location. All data and visualizations are updated in real time as the test continues to run, enabling continuous performance monitoring and faster issue detection.
Wrapping up
DNS checks are an important way to verify if DNS issues are at the root of performance problems. By leveraging Grafana Cloud Synthetic Monitoring, you can easily implement, monitor, and manage DNS checks to ensure the reliability of your most critical services.
To learn more about Synthetic Monitoring, please refer to our technical docs. You can also explore this dashboard on Grafana Play, which features example checks.
Lastly, while Synthetic Monitoring tracks the performance of user flows and applications, what about the experience your users are actually having? Grafana Cloud Frontend Observability gives you real user monitoring with real-time, actionable insights into performance, errors, and user journeys across your applications. To learn more, refer to the technical documentation.
Grafana Cloud is the easiest way to get started with synthetic monitoring. We have a generous free tier that includes 100k test executions per month and more. Sign up for free now!

