

Debug, query, and build faster with AI: How we use Grafana Assistant at Grafana Labs
We recently released Grafana Assistant into public preview for Grafana Cloud, and we've been excited to see how our customers have already made it part of their daily observability routines.
At the same time, Assistant is becoming a go-to companion for developers right here at Grafana Labs, whether they're debugging on-call issues, helping customers, or trying to remember tricky PromQL syntax.
Our developers love how it fits naturally into their existing workflows, helping them save time and reduce friction. And in the spirit of transparency, we want to give you a peek behind the scenes to share how they're getting the most from our integrated chat agent.
Specifically, you'll read real-world testimonials about how Assistant:
- Saves time when you know the data exists but cannot recall the query or the corresponding label names
- Simplifies writing queries you don't quite remember
- Explains cryptic logs in plain English
- Speeds up onboarding for new users
- Makes creating or editing dashboards faster and easier
Finding the information you know exists
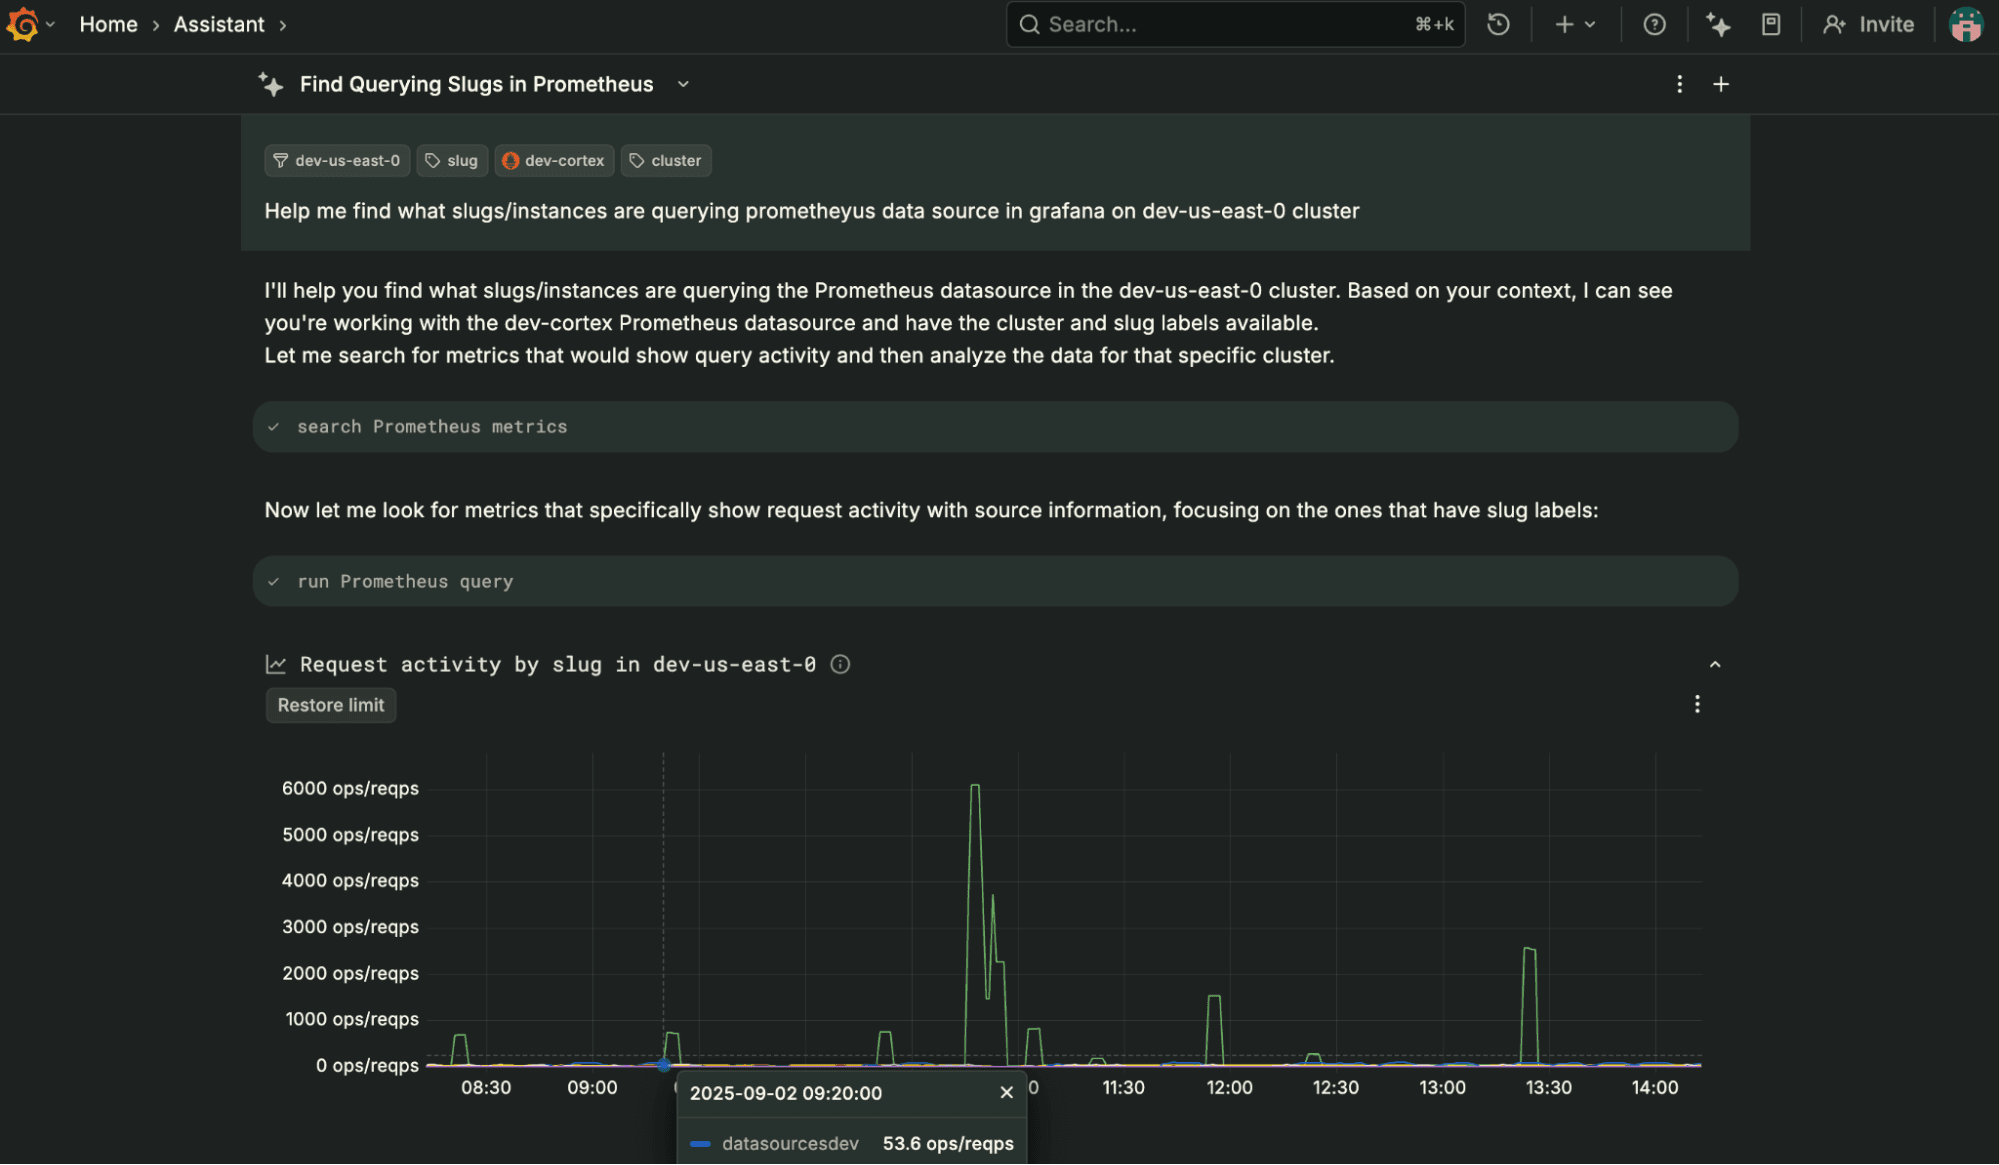
Sometimes the hardest part isn’t running a query—it’s knowing which query to run. This is especially true when you know the data must be there somewhere, but you can't quite remember how to get to it.
Assistant can save time by suggesting the right path forward. To make its answers even more accurate, it helps if you include important context such as:
- The data source you are using
- The metrics or labels you care about
- Any specific filters you want to apply
The more detail you provide, the more useful the results will be.
“As Grafana Labs has scaled, it is harder to remember all the metrics and labels across data sources. I knew the data I needed was in the logs, but I had no idea what query to write. I wanted to find customers in a specific region running a certain version of Grafana, but I was stuck on how to get there. Grafana Assistant gave me the explanation I needed in seconds, saving me 30 minutes or more. It turned a frustrating problem into something I could solve quickly without bothering teammates.”
- Sarah Zinger, Staff Software Engineer for Grafana Core Services
“I was helping a user size a Pyroscope deployment and needed to know how much S3 storage our production bucket was using. I knew the data existed somewhere in our metrics or logs, but finding it would have taken time with either Grafana or the AWS CLI. As a last attempt, I asked the Assistant and it worked. It gave me the number right away and saved me about an hour of digging. The best part is that it is always right there, wherever I go in Grafana.”
- Bryan Huhta, Senior Software Engineer for Grafana Pyroscope
Takeaway: When you know the data is there but not how to get to it, Assistant can bridge the gap in seconds.
Explaining logs, traces, and profiles in plain language
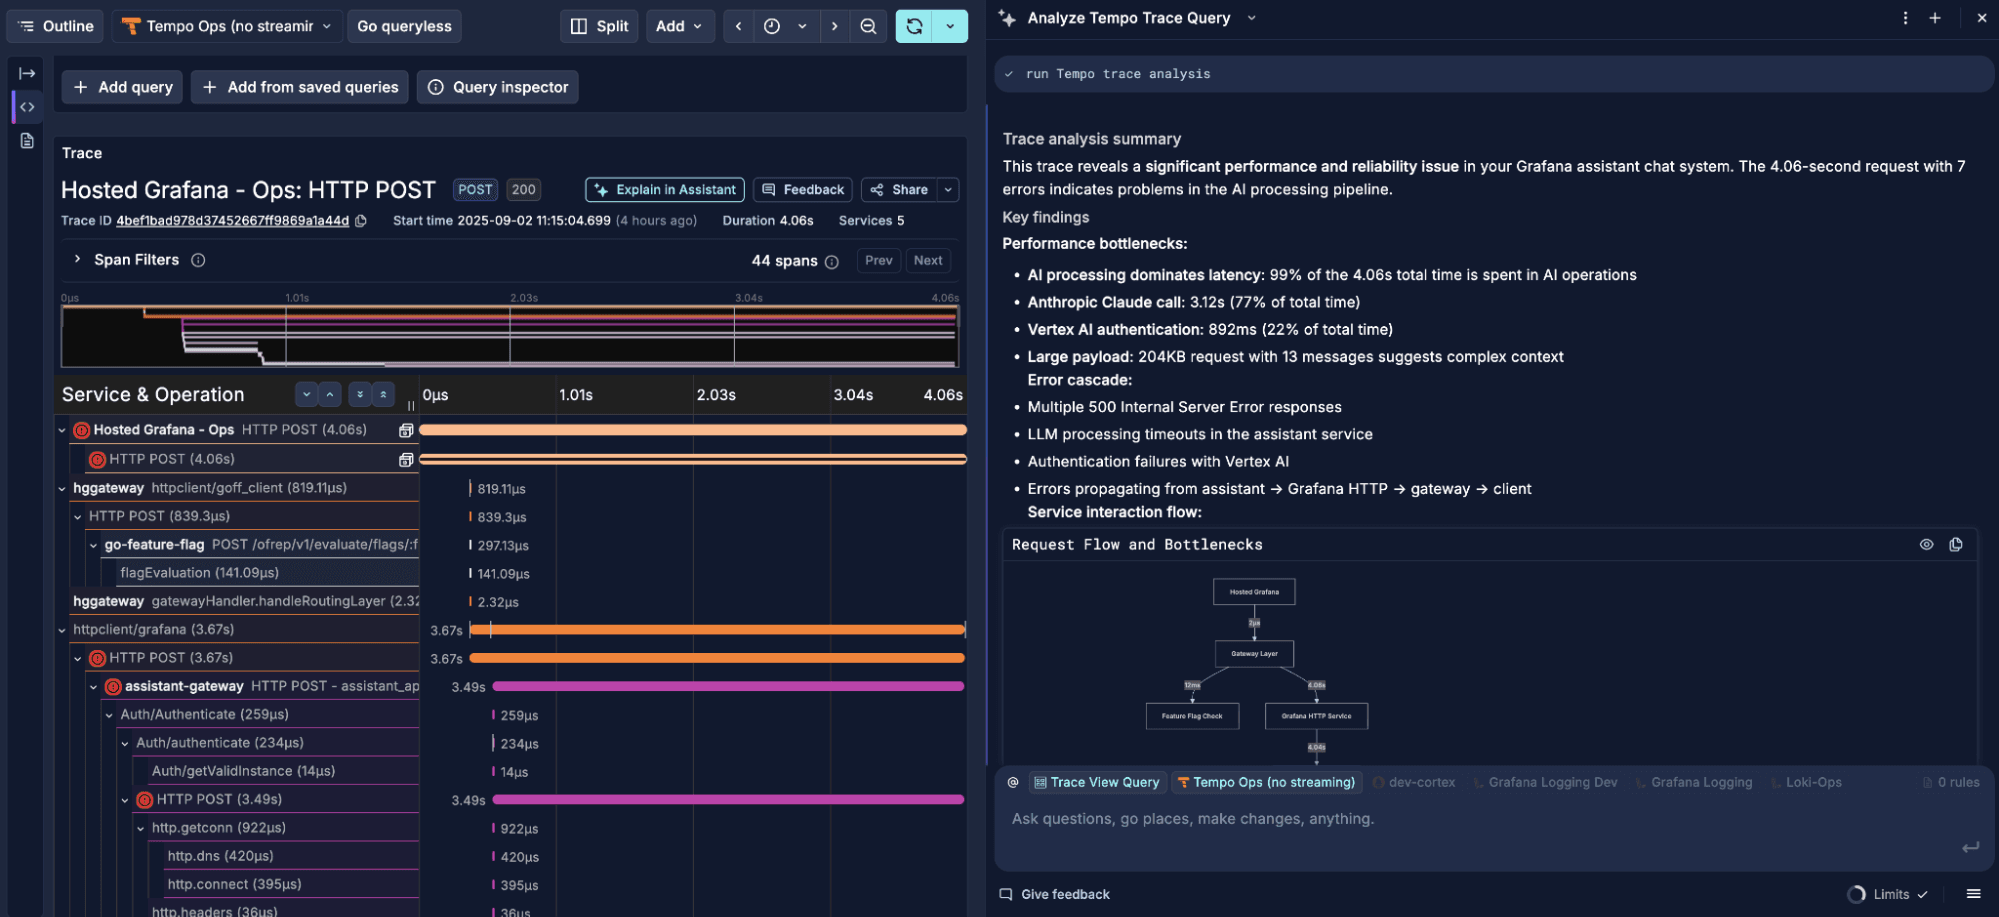
When you're on call, every minute matters. Telemetry signals such as logs, profiles, and traces often contain the answers, but interpreting them can be slow—and overwhelming. All these signals now come with "Analyze in Assistant" or "Explain this log line" options right from the visualization, so you can interact with them directly instead of digging through raw data.
Assistant speeds up the process by breaking errors and performance data into plain language and pointing directly to what matters.
“This one was a bit funny because Assistant actually helped me debug an issue with the Assistant backend services itself. We got an error alert for a spike in request errors, so we began our investigation. The key moment came when we looked at some traces from our backend service and used 'Analyze this trace.' Instead of piecing together spans and timings on our own, Assistant translated the trace into plain language, highlighted where time was being lost, and even correlated the data with other spikes in latency we were seeing in metrics. That quickly pointed us to the root cause: a newly released feature that consumed an unprecedented amount of resources, causing our databases to run out of connections, memory, and CPU.”
- Sven Großmann, Staff Software Engineer for Grafana Assistant
Takeaway: Assistant makes traces and spans easier to understand, helping you move from alert to root cause much faster.
“While on call, I hit a cryptic error in the logs that mentioned an invalid UUID but gave no real context. Instead of combing through the raw output, I used 'Explain this log line,' which I found in the log line menu dropdown. The assistant pinpointed the exact field with the invalid value, explained why it caused the error, and suggested how to fix it. What could have taken a long time to debug manually turned into a quick resolution.”
- Ivana Huckova, Senior Software Engineer for Grafana Data Sources (and co-author of this blog post)
Takeaway: Assistant helps you understand errors in plain language, saving you from staring at confusing logs.
Dashboard creation and editing
Building and maintaining dashboards can be one of the more time-consuming parts of working with Grafana. Assistant makes it easier by handling tasks like bulk editing queries or panels, saving time and cutting down on repetitive work.
“One of the most helpful ways I’ve used Assistant was when I needed to update a dashboard that tracks usage of new features I’m working on. I wanted to change the thresholds that highlight adoption across all panels, and instead of manually editing each one, I simply described the change. Assistant generated the updates for me, turning a task that would normally take several minutes of tedious work into something I finished almost instantly.”
- Piotr Jamróz, Staff Software Engineer for Observability Traces and Profiling

“We’re using a lot of SQL tables internally to look at our usage data. Grafana Assistant helps me to sift through these tables quickly to find the content I’m interested in and also gets me started on writing queries to build my panels. Adoption, retention, churn and other business KPIs are only one sentence away using the assistant.”
- Maurice Rochau, Senior Product Manager for Grafana AI (and co-author of this blog)
Takeaway: Grafana Assistant automates tedious dashboard work for you so that you can focus on other work.
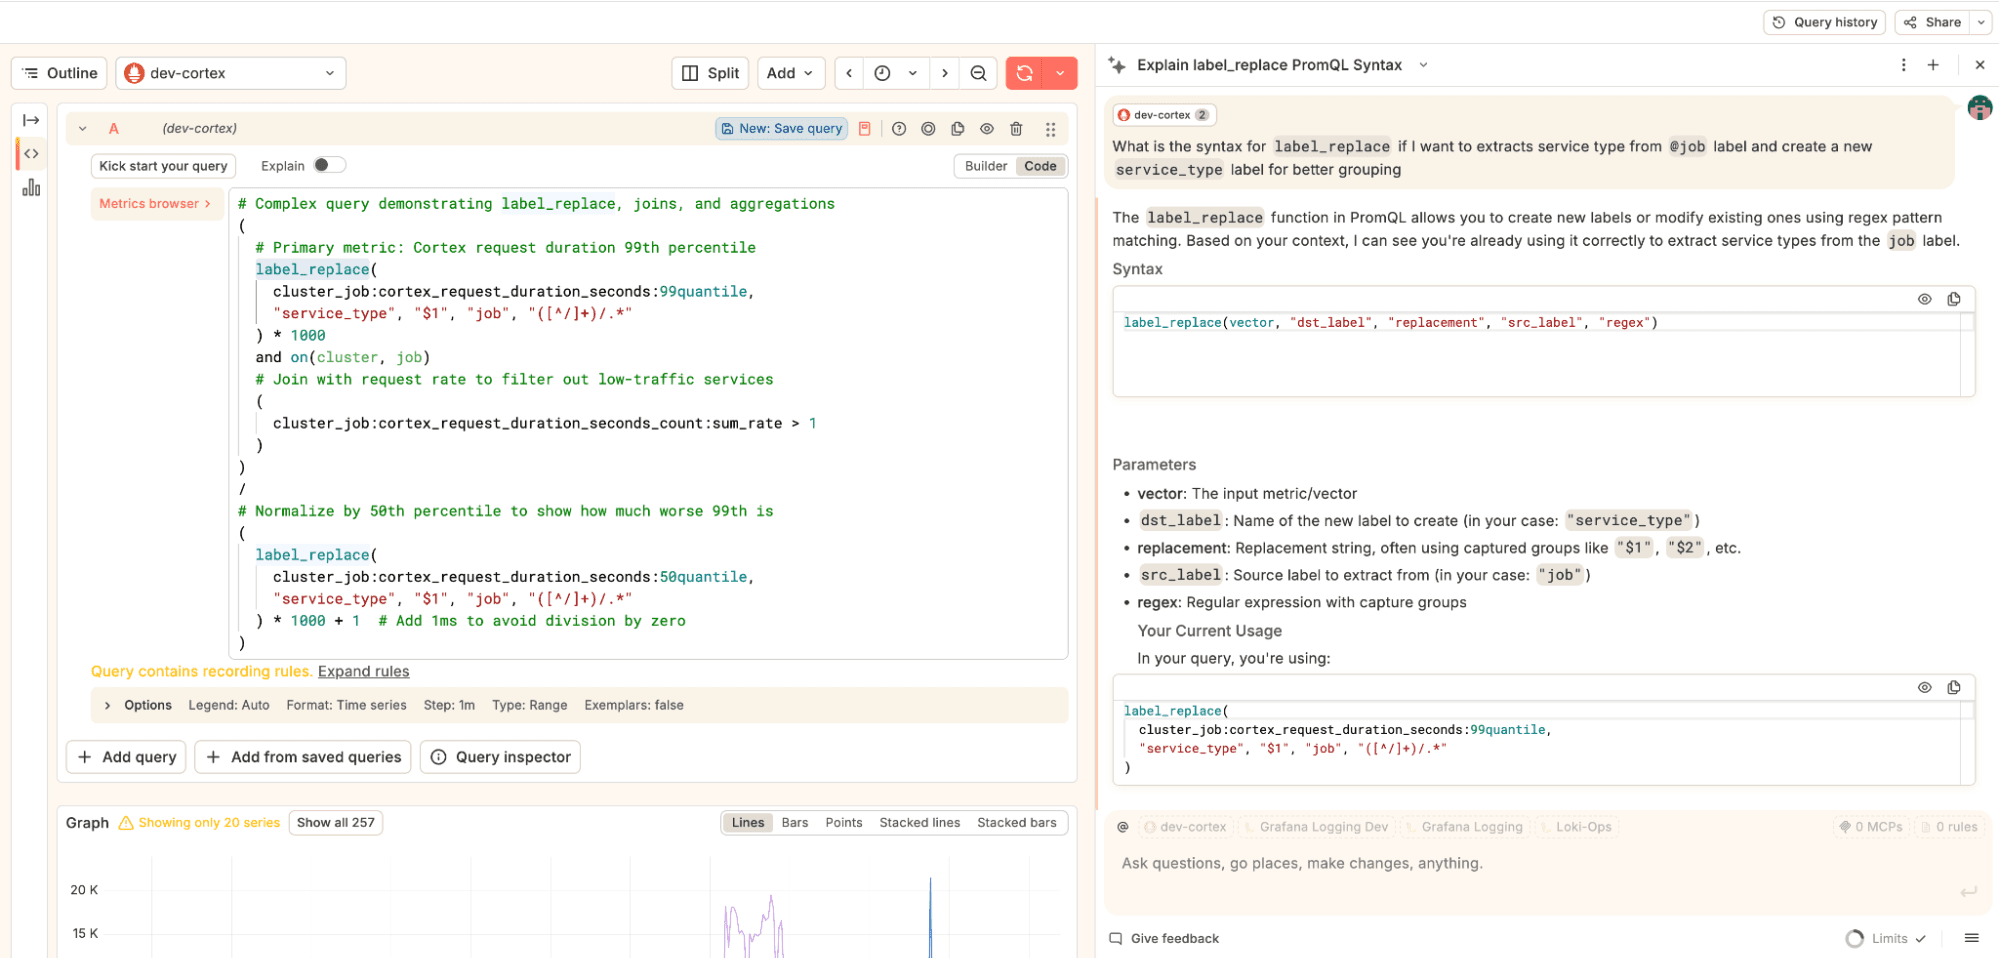
“I use the Assistant a lot for query help, especially with PromQL syntax I never remember like
label_replaceorgroup_left. Instead of digging through docs, I just describe what I want and get the correct query right where I am writing it. For example, I used it to group status codes by their first digit withlabel_replace, and another time to join metrics withgroup_leftto pull labels from an info metric. Having this built into Grafana means I never lose flow when building queries.”- Dafydd Thomas, Staff Software Engineer in Grafana Core Services
“Oftentimes as solutions engineers we work with customers who want to understand what a migration from one observability vendor to another would look like. It is always a challenging task given the breadth of different tools out there. In the past, this usually meant relying on my own experience or pulling in subject matter experts. For example, I once asked on Slack how to search across all log lines in Loki, and while I eventually got a good answer, it took time and was not scalable. With the Assistant, I was able to get the same answer immediately and even ask for best practices as the customer planned their migration from their vendor to Grafana Cloud Logs. It wasn't just a translation of syntax, it guided the conversation toward recommended practices, which made the discussion with the customer much more valuable.”
- David Tupper, Associate Solutions Engineer
Takeaway: Assistant helps answer questions, no matter what they are, as long as the data is there.
Onboarding to Grafana made easier
Learning a new platform can be overwhelming. There are new concepts to understand and unfamiliar tools to configure. Assistant makes onboarding interactive and contextual by letting you ask questions directly about your setup and guiding you step by step through real workflows.
“As someone new to Grafana, Assistant made getting started much smoother and more efficient. Instead of spending hours reading documentation or asking teammates basic questions, I could ask the Assistant directly about my setup. For example, when creating a dashboard for my home server’s Nextcloud instance, it guided me through the query syntax and panel configuration. What would have taken me hours of trial and error was done in a fraction of the time.”
- Kevin Adams, Senior Software Engineer for Grafana Assistant
Takeaway: For new hires or users, Assistant turns onboarding from overwhelming into empowering. If you want to dig into this deeper, check our deep dive on using the assistant to help your teams get started quicker with Grafana Cloud.
Start using Assistant today
Grafana Assistant is here to amplify knowledge. Developers drive the process, but with Assistant by their side, they spend less time stuck and more time solving problems.
The next time you are debugging, writing a tricky query, or onboarding a new workflow, let Assistant lend a hand. Grafana Assistant is currently in public preview and is available in every Grafana Cloud instance. You don’t need to install anything extra, just log in to Grafana Cloud and look for the pulsar icon. You’ll see Assistant ready to use in your dashboards, Explore, and more.
And if you haven’t tried Grafana Cloud yet, you can sign up for a forever-free account today and start exploring with Grafana Assistant right away!
And for more information on Grafana Cloud AI, including FAQs about Assistant and our other AI capabilities, check out our AI observability page.
Grafana Cloud is the easiest way to get started with metrics, logs, traces, dashboards, and more. We have a generous forever-free tier and plans for every use case. Sign up for free now!

