
AI for Grafana onboarding: Get your teams started quicker with Grafana Assistant
Grafana puts a powerful set of observability capabilities right at your fingertips, but onboarding entire teams to the sophisticated platform is often a nontrivial exercise—one that can slow adoption and prevent organizations from getting immediate value.
We want to make the process as frictionless as possible, which is why we're excited to tell you that Grafana Assistant is now available in public preview to all Grafana Cloud users. Our integrated chat agent can be a vital tool for getting started on the platform, helping new users answer questions, navigate to the right places in Grafana, and even have action taken on their behalf.
Of course, Grafana Assistant can help you get more done with Grafana Cloud in any number of ways, but in this blog post we're going to focus on how it can help you and your organization quickly and successfully get onboarded with Grafana, whether you're migrating from another tool or just starting your observability journey.
Keep reading for tips on how Grafana Assistant can help you get the most from your stack. And if you're following along at home or in the office, simply click on the pulsar icon in the top-right corner of the Grafana Cloud UI to open the assistant and enter the example prompts provided below.

Learn observability concepts
Sometimes you run into unfamiliar concepts or technologies—especially those with multi-letter acronyms. This can slow you down as you constantly reach for your favorite search engine or external chat agent to learn more.
Well, the same thing can happen if you have limited exposure to observability. But with Grafana Assistant, you get that same help you're used to searching for elsewhere without ever having to leave Grafana Cloud—no context switching needed!
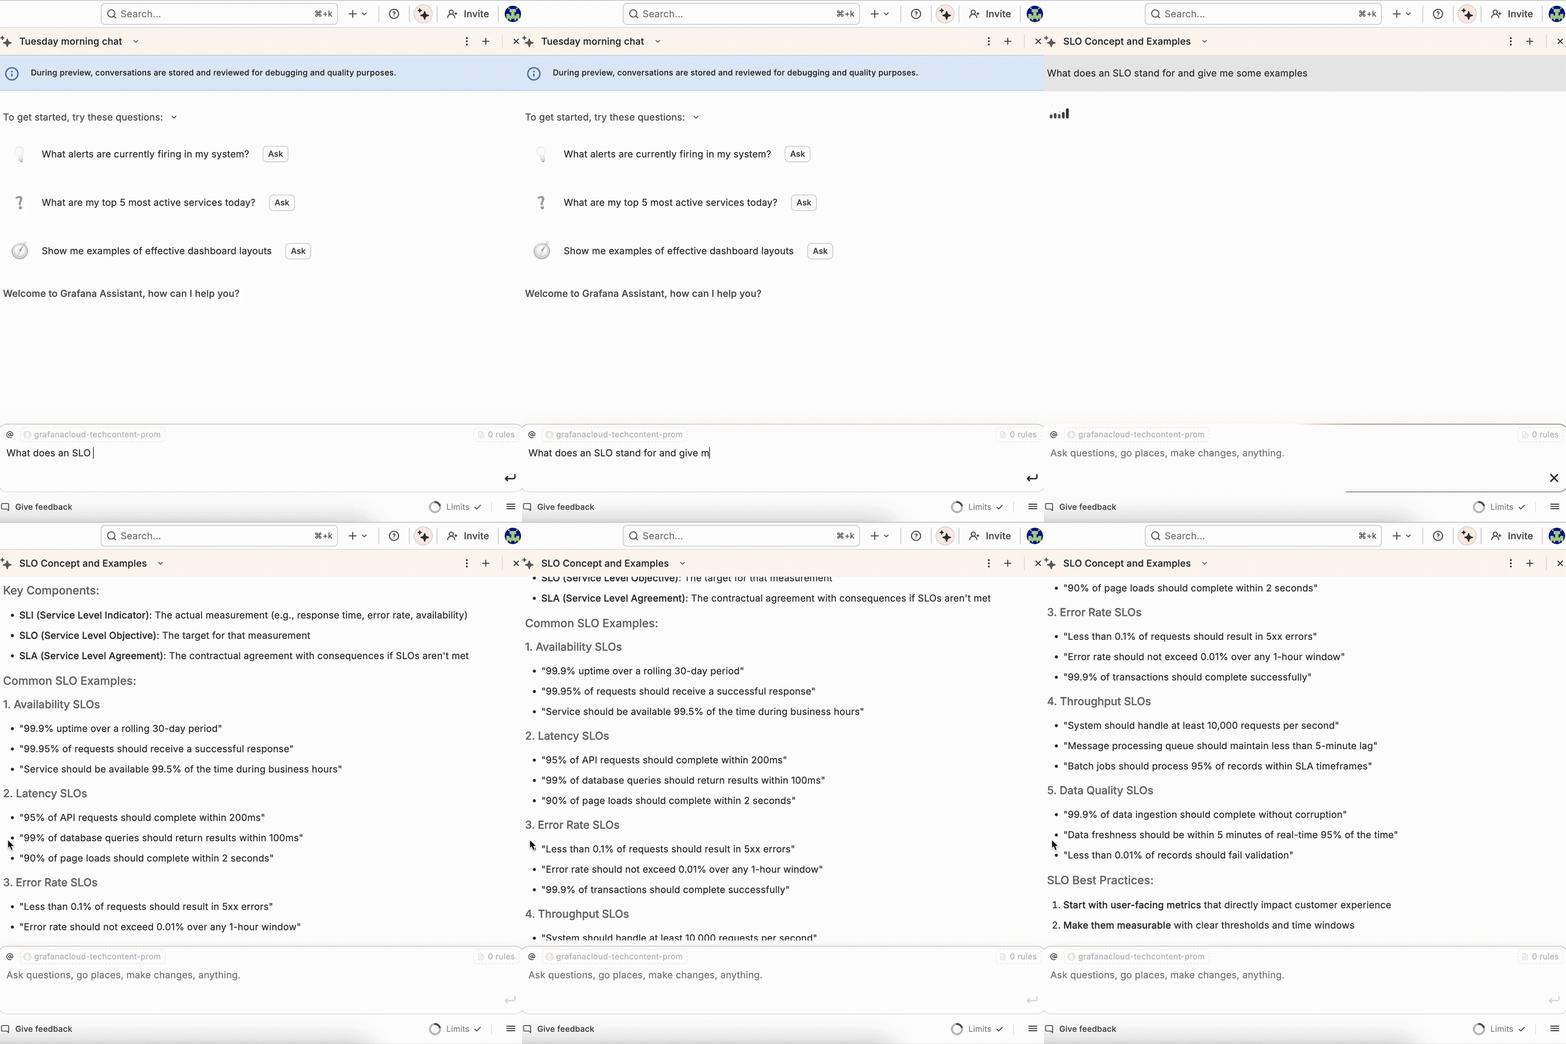
Plus, there's an extra twist: The answers will be tailored to your observability stack. For example, if you ask about uptime and you have HTTP servers logging and providing metrics to Grafana, Grafana Assistant will intelligently figure out what you’re referring to.
Try these sample questions to see for yourself:
- What is an aggregated metric?
- What does SLO stand for?
- How many metrics is too many?
Compare concepts from different platforms
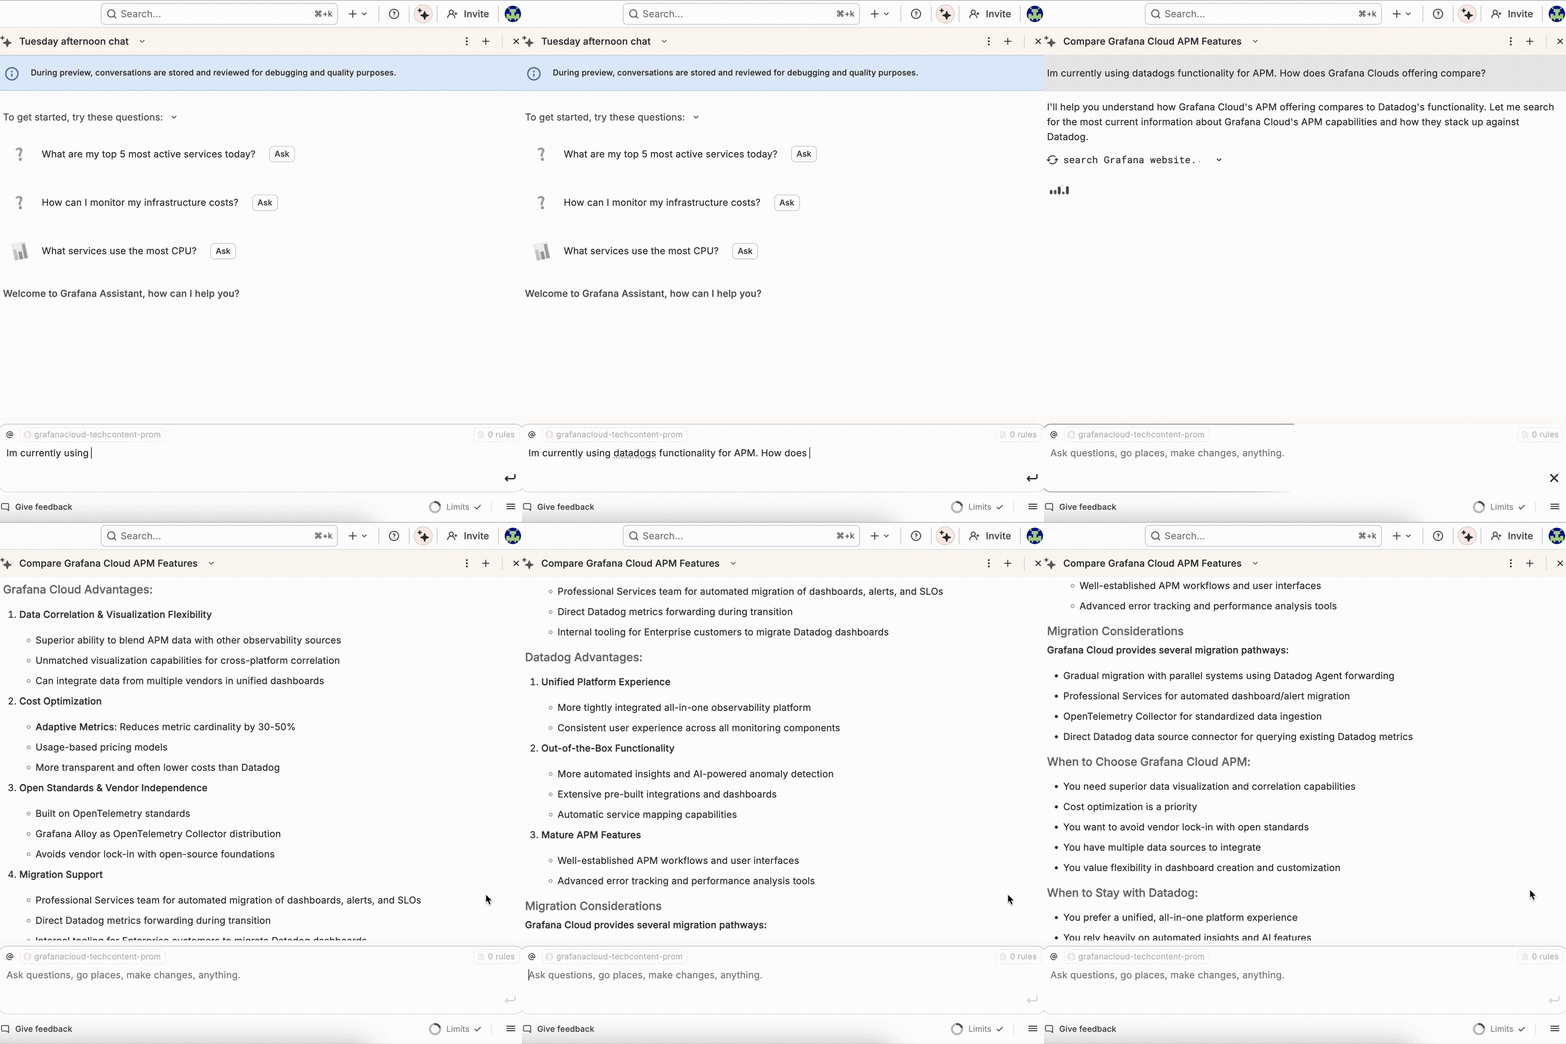
Now, maybe you're well versed in observability, but you're less familiar with Grafana. When moving from another platform, it’s possible that some of the concepts don’t fully line up. It's also possible that Grafana tackles certain problems differently than your previous tooling.
But don't worry—Grafana Assistant is generally aware enough to compare those concepts and explain the differences, including providing extra detail where requested. And don’t be afraid to ask follow up questions as needed (more on this at the end).
Try these sample questions, and replace the uppercase text as needed:
- In my other observability stack I used OBSERVABILITY_FEATURE. What’s the Grafana equivalent?
- What does Grafana call OBSERVABILITY_FEATURE?
- In OLD_OBSERVABILILTY_STACK I used to be able to do COOL_THING. How do I achieve that in Grafana?
Get context-aware answers about your stack
Once you've got the basic concepts down, it's time to find out what you can actually do in Grafana Cloud. But maybe you're not quite ready to learn everything just yet.
Many new users simply want to poke around and get a feel for the environment first. The problem with this approach is that you don't know what you don't know, which can be especially frustrating (and overwhelming) when you have so much to choose from.
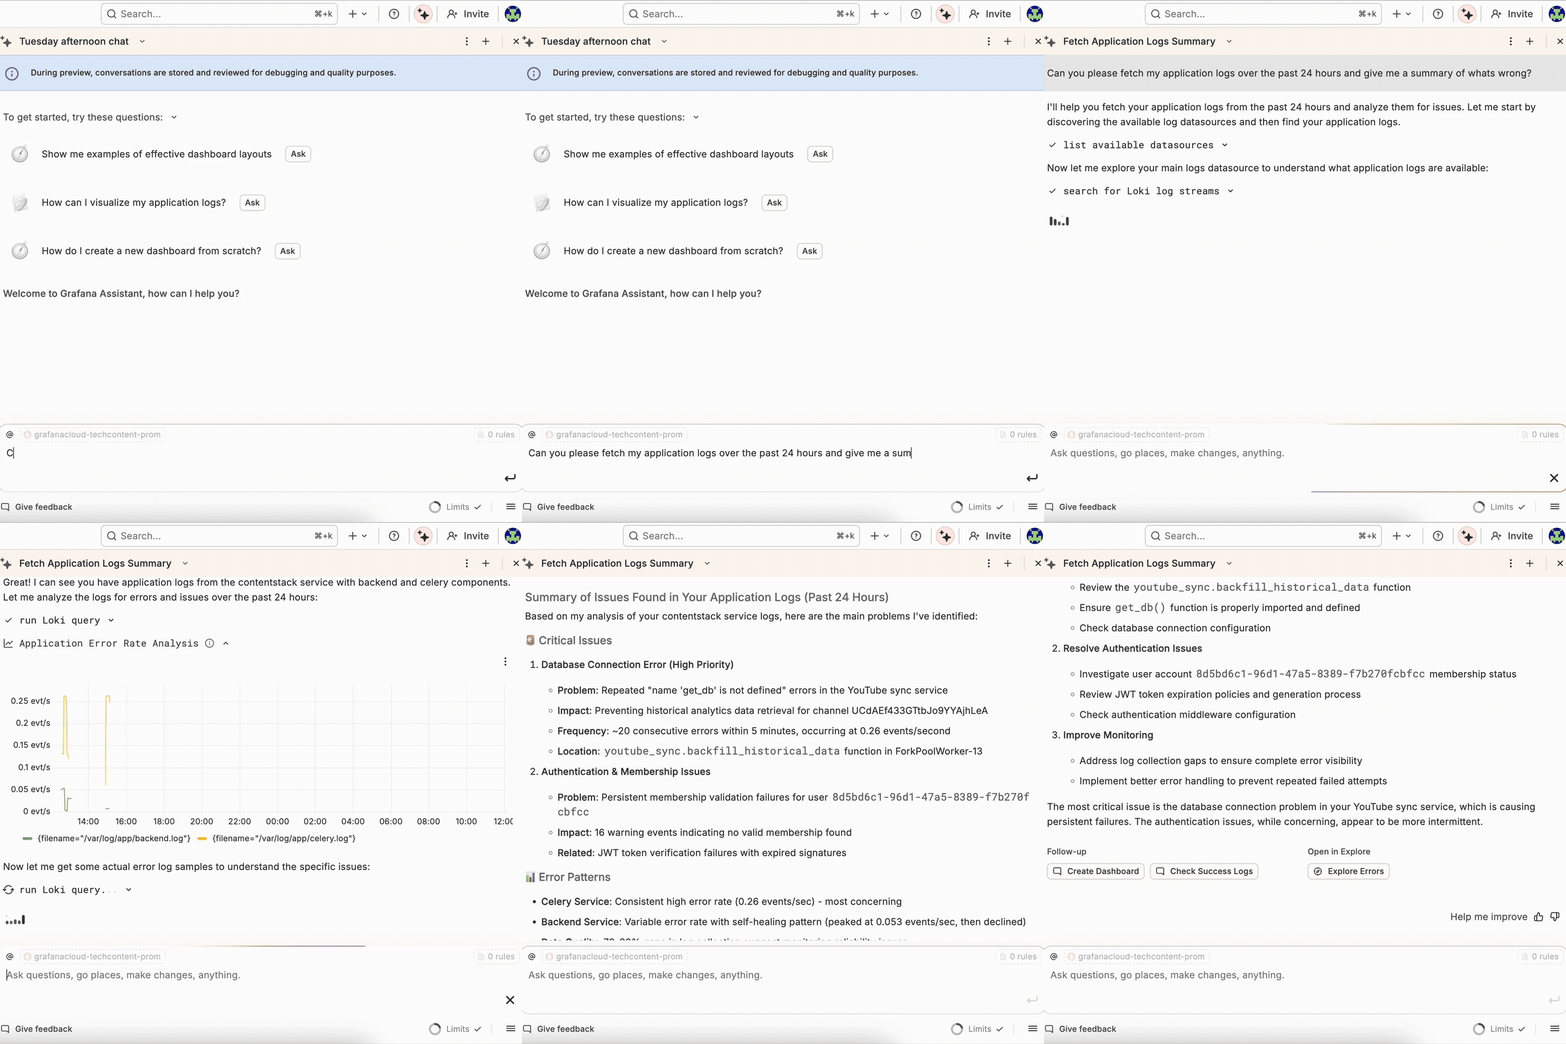
Grafana Assistant sits in the sidebar next to whatever you’re working on in Grafana Cloud. More importantly, it can see the context on the page, so questions are answered specifically about your stack, often including real examples from your actual telemetry signals.
Try these sample questions:
- What am I supposed to do on this page?
- Can you explain the data I’m seeing here?
- Where can I learn more about this?
Follow customized interactive tutorials
As you continue your onboarding experience, perhaps you find that you’re curious about how a specific UI works, or how to solve a particular problem using the tools. Grafana Assistant can provide a step-by-step guide that's customized to your request, skipping over steps that aren't relevant and focusing instead on what matters most for your needs.
As you make changes, you can keep the conversation going. Either continue probing to learn more details, or ask it to help with tangential things as you go. The assistant will adapt to how you work best.
Try these sample questions:
- How do I add an alert for this metric?
- What does it take to add a new on-call schedule in Grafana Cloud IRM?
- What steps should I follow to declare a test incident?
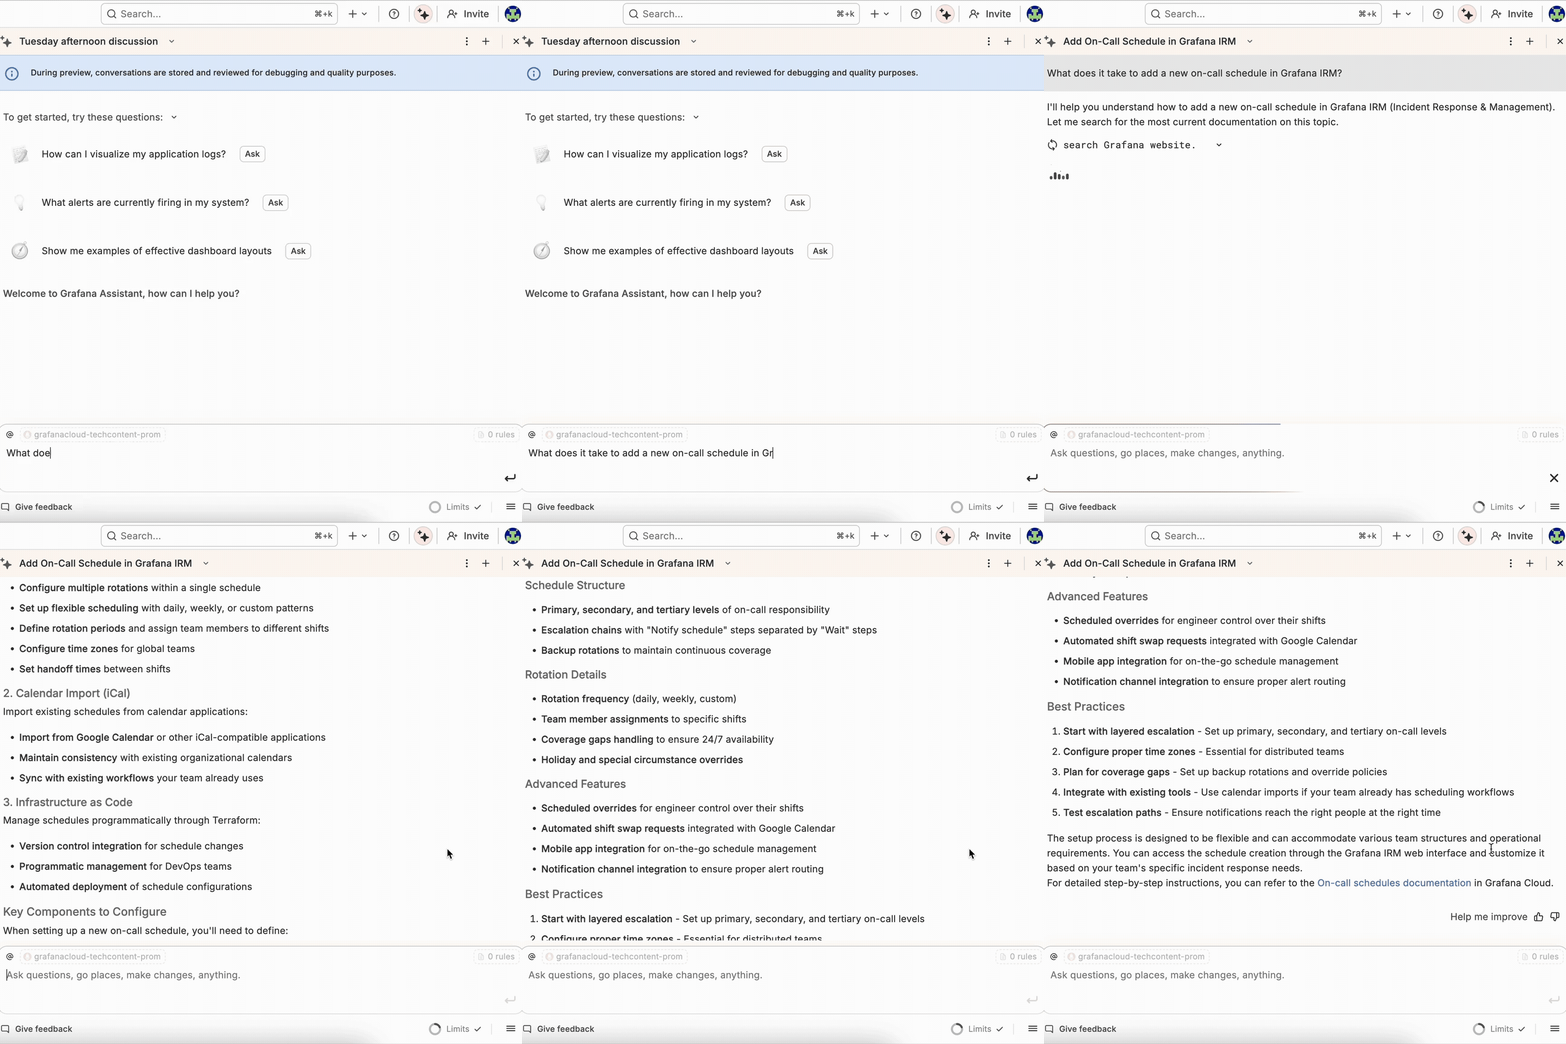
Note: If you still need to get started with Grafana Assistant in the first place, it can also help you with that, too. The first time you open the chat agent, you'll be guiding you through a dedicated tutorial for Grafana Assistant.
Ask about best practices
At this point, you're ready to refine and optimize your usage, but you aren't quite sure what you need to do differently. Thankfully, Grafana Assistant is packed with knowledge about the platform that can help you do just that.
Some of that information is baked in via the prompts and tools we send to the LLMs. Other knowledge comes via access to the Grafana documentation and blog articles, which carry special weight in the AI’s estimations and will help guide you to the best solution. As the documentation is pulled in in real time, you can be sure that you always receive up-to-date information on our products.
Try these sample questions:
- What should I be monitoring to ensure Kafka is operating correctly?
- What level of CPU usage should I alert on?
- Should I add instrumentation to everything in my stack, or just the important things?
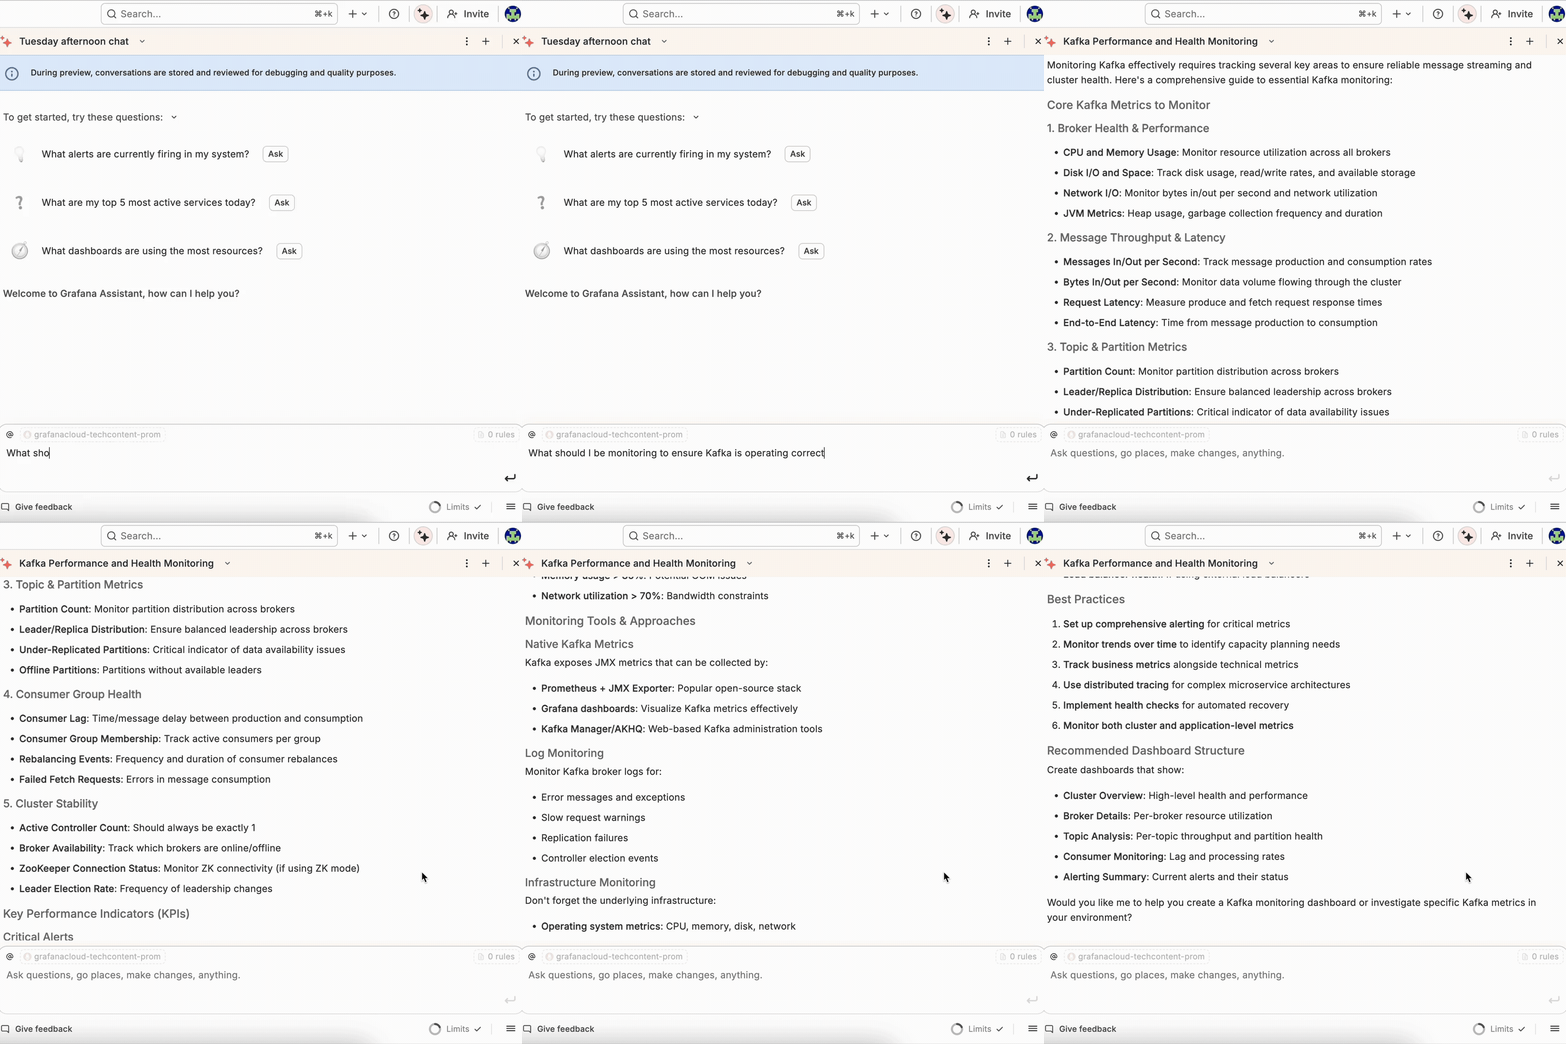
Remember: It’s a conversation
Grafana Assistant will always try to answer your questions, but the more context it has, the better.
Correct it if it makes mistakes, provide more context where it seems confused, and don’t be afraid to direct it towards the kinds of answers you’re looking for. In this regard, it’s like working with a colleague: The more context you provide, the better your collaboration at large.
Bonus tip: Remain polite. It seems like the AI will produce better results when the language is positive in sentiment. We’ll leave it as an exercise for the reader to figure out why that might be.
You and Grafana Assistant will get better all the time
Observability is diverse: Different companies have different stacks that solve different problems. At Grafana Labs, we support small and big companies across a wide range of industries, which also means that observability problems vary significantly.
However, we don’t want to develop an assistant feature that only caters to a narrow set of situations. Instead, we want Grafana Assistant to help anyone—regardless of their observability maturity—to run things just a bit more smoothly.
Enabling Grafana Assistant is simple: Either click on the Grafana Assistant symbol in the top-right corner of the UI, or click on the corresponding menu item in the main navigation on the left side of the UI.
As you use Grafana Assistant, you will also learn the nuances of interacting with an LLM. The prompt and context are everything to the LLM, so some things will work better than others. As you use the Assistant to solve real world problems, the way you interact with it will evolve. So don’t be downhearted if the first few things you try don’t give you the results you’re after.
We are investing heavily to continually develop Grafana Assistant, so you should notice improvements in behavior on a weekly basis. Your feedback helps us do this, so please use the thumbs-up and down icons, and if you can, leave a meaningful comment explaining what happened, and what you expected.
So start using Grafana Assistant today to upgrade your observability experience! And if you want to learn more about Grafana Assistant and our entire suite of AI tools, sign up for ObservabilityCON 2025 in London or an ObservabilityCON on the Road near you for more AI-powered observability announcements.
FAQ: Grafana Cloud AI & Grafana Assistant
What is Grafana Assistant?
Grafana Assistant is an AI-powered agent in Grafana Cloud that helps you query, build, and troubleshoot faster using natural language. It simplifies common workflows like writing PromQL, LogQL, or TraceQL queries, and creating dashboards — all while keeping you in control. Learn more in our blog post.
How does Grafana Cloud use AI in observability?
Grafana Cloud’s AI features support engineers and operators throughout the observability lifecycle—from detection and triage to explanation and resolution. We focus on explainable, assistive AI that enhances your workflow.
What problems does Grafana Assistant solve?
Grafana Assistant helps reduce toil and improve productivity by enabling you to:
- Write and debug queries faster
- Build and optimize dashboards
- Investigate issues and anomalies
- Understand telemetry trends and patterns
- Navigate Grafana more intuitively
What is Grafana Labs' approach to building AI into observability?
We build around:
- Human-in-the-loop interaction for trust and transparency
- Outcome-first experiences that focus on real user value
- Multi-signal support, including correlating data across metrics, logs, traces, and profiles
Does Grafana OSS have AI capabilities?
By default, Grafana OSS doesn’t include built-in AI features found in Grafana Cloud, but you can enable AI-powered workflows using the LLM app plugin. This open source plugin connects to providers like OpenAI or Azure OpenAI securely, allowing you to generate queries, explore dashboards, and interact with Grafana using natural language. It also provides a MCP (Model Context Protocol) server, which allows you to grant your favorite AI application access to your Grafana instance.
Why isn’t Assistant open source?
Grafana Assistant runs in Grafana Cloud to support enterprise needs and manage infrastructure at scale. We’re committed to OSS and continue to invest heavily in it—including open sourcing tools like the LLM plugin and MCP server, so the community can build their own AI-powered experiences into Grafana OSS.
Does Grafana Cloud’s AI capabilities take actions on its own?
Today, we focus on human-in-the-loop workflows that keep engineers in control while reducing toil. But as AI systems mature and prove more reliable, some tasks may require less oversight. We're building a foundation that supports both: transparent, assistive AI now, with the flexibility to evolve into more autonomous capabilities where it makes sense.
Where can I learn more about Grafana’s AI strategy?
Check out our blog post to hear directly from our engineers.
Grafana Cloud is the easiest way to get started with metrics, logs, traces, dashboards, and more. We have a generous forever-free tier and plans for every use case. Sign up for free now!


