
Grafana Cloud updates: deeper insights in Kubernetes Monitoring, Adaptive Metrics updates, and more
We consistently roll out helpful updates and fun features in Grafana Cloud, our fully managed observability platform powered by the open source Grafana LGTM Stack: Loki for logs, Grafana for visualization, Tempo for traces, and Mimir for metrics.
In case you missed them, here’s our monthly round-up of the latest and greatest updates in Grafana Cloud. You can also check out our What’s new in Grafana Cloud documentation to explore all the latest features.
Not a Grafana Cloud user yet? Sign up for an account today! You can try any of these features (and more) for free with our generous Cloud Free plan.
Deeper insights into EC2 instances and GPUs in Kubernetes Monitoring
This month, we have two new features in Grafana Cloud Kubernetes Monitoring that can help you troubleshoot faster, and gain deeper insights into your Kubernetes environments.
First, you can now easily pivot from Kubernetes Monitoring to a specific Amazon EC2 instance in Cloud Provider Observability when that instance is impacting performance or stability. Whether it’s a failing node, resource exhaustion, or an unreachable instance, this seamless cross-layer visibility removes manual guesswork and eliminates the need for context-switching.
In addition, it’s now possible to view GPU utilization panels on the GPU tabs of the Cluster and Node detail pages in Kubernetes Monitoring. This helps you discover whether Nvidia GPUs inside the cluster are appropriately utilized and whether workloads are getting and using the GPU resources that have been made available.

To learn more, please check out our technical docs.
Improved security and easier clean-up in Fleet Management
We have two exciting updates to share related to Grafana Fleet Management this month: support for AWS PrivateLink and a new, automated process to clean up your inventory of collectors.
Support for AWS PrivateLink
Fleet Management now supports Amazon Web Service (AWS) PrivateLink, enabling you to securely connect your virtual private clouds (VPCs) to Fleet Management APIs without using the public internet.
With AWS PrivateLink, you can:
- Reduce your AWS egress costs
- Improve security by keeping your data within the Amazon network

You can check out our docs to set up your secure connection today.
Collector inventory cleanup
The days of manually deleting inactive collectors from your inventory are over.
Fleet Management now automatically marks collectors inactive if they haven’t polled for a remote configuration in the last three hours. Collectors that are inactive for 30 days are deleted from your inventory.
By default, inactive collectors are hidden from view in the Fleet Management application. You can switch the filter to Inactive to see them.
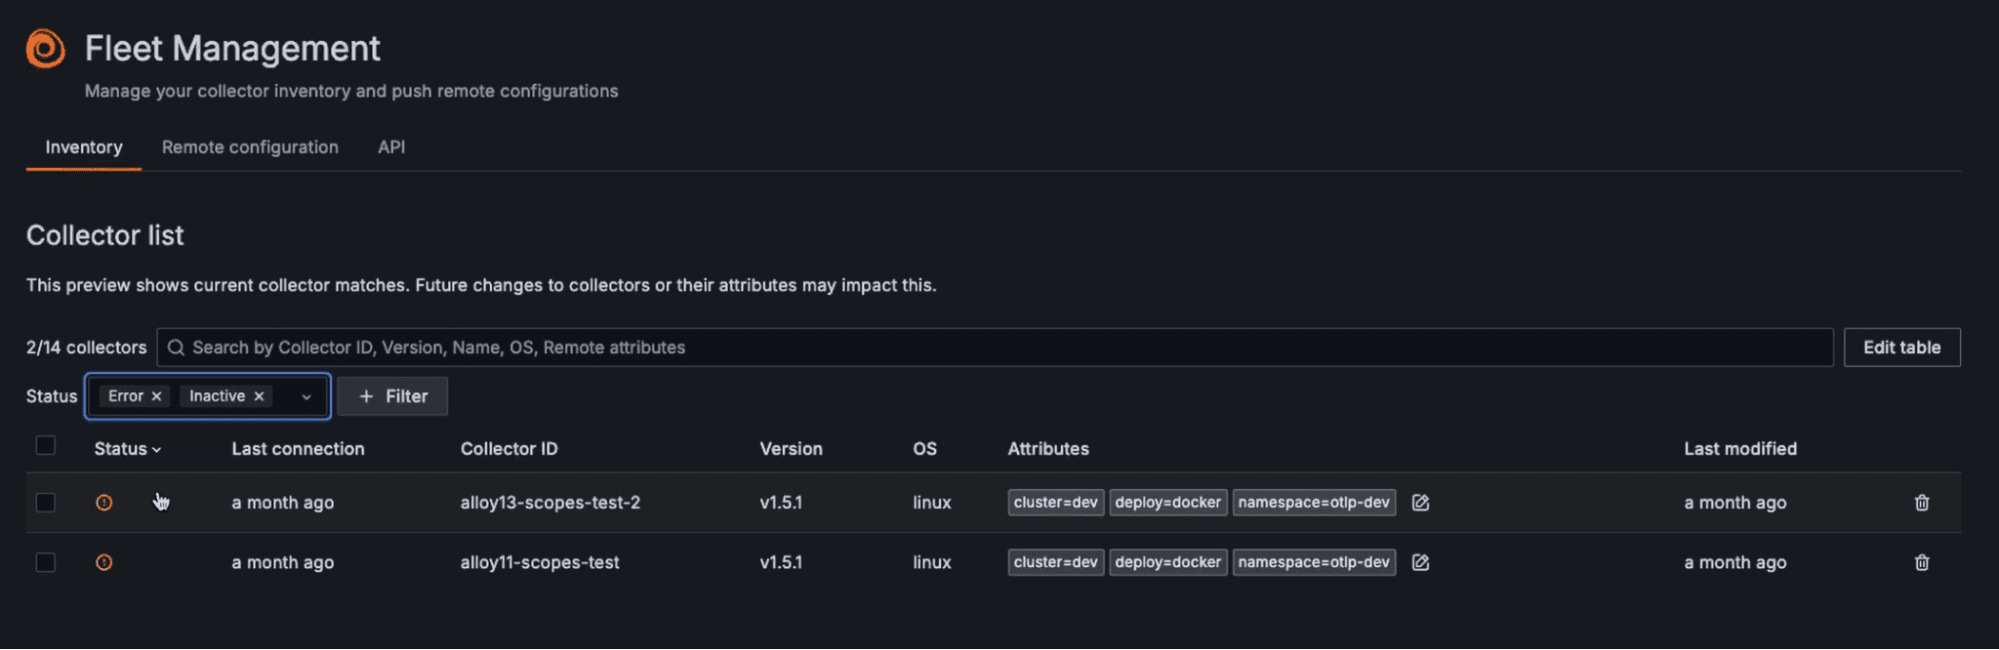
To learn more, please visit our Fleet Management docs.
A faster way to tap into the benefits of Adaptive Metrics
Adaptive Metrics is a metrics management and cardinality optimization tool that eliminates unused and partially used metrics through aggregation. And now, with the new auto-apply feature, you get all the benefits of Adaptive Metrics — which is part of the Adaptive Telemetry suite of solutions in Grafana Cloud — even faster.
Using auto-apply, recommendations are applied automatically, without a human in the loop. It helps you maximize your cost savings and observability outcomes by spending less time reviewing recommendations.
You can enable auto-apply using the Adaptive Metrics GUI, API, or Terraform provider. Auto-apply also optionally works with segmentation; sub-divide your recommendations to manage on a per-team basis, and choose to auto-apply at a segment level.
The feature is currently in public preview. We recommend that you use the Exemptions feature before turning on auto-apply to ensure any critical metrics are not aggregated inadvertently.
You can learn more about configuring auto-apply in our Adaptive Metrics docs.
Dashboard and visualization updates
Whether you’re digging into specific metrics or building complex dashboards, these new features help you explore your data with greater flexibility and more granular control.
Regression analysis transformation
In Grafana, transformations are a powerful way to manipulate data returned by a query before the system applies a visualization. This month, we’re sharing that the regression analysis transformation is now generally available.
This new transformation fits a mathematical function –– either a linear (shown below) or polynomial regression –– to any data set to predict values at a certain point of time that may not be represented in the original data set.

In other words, you’re creating a new data frame containing values predicted by a statistical model, which is particularly useful when trying to find a trend in chaotic data.
You can see an example of this transformation on Grafana Play and read more in our documentation.
Custom variable support in visualization actions
The ability to define custom variables within visualization actions is also now generally available.
When you trigger an action (such as an API request), you’ll be prompted to provide input for those variables. This makes actions more dynamic and interactive, allowing you to tailor requests in real time without modifying the dashboard configuration.

This feature is especially useful when you’re triggering alerts, filtering API calls, or sending user-defined parameters to external systems.
Enhanced custom currency format
It’s now possible to show exact financial values (or abbreviate them) to give you more control over what’s displayed in your dashboards.
Previously, Grafana automatically abbreviated large currency values — for example, $1,235,667 would be abbreviated to $1.24M or $555,558 to $555.6K. While this works well for most visualizations, financial data often requires values to be, well, right on the money.
So, we enhanced our custom currency format to solve this. Instead of the standard format, you can now use currency:financial:<unit> to display the exact and complete numeric value. For example, currency:financial:$ will format large values like 1235667 as $1,235,667 instead of $1.24M.
The financial format also supports flexible symbol positioning, including:
Prefix (default): currency:financial:$ to display $1,235,667
Suffix: currency:financial:€:suffix to display 1,235,667€
Static options for query variable
It’s now possible to define additional static options for the query variable to be included with the options retrieved by querying the data source. This offers you more flexibility, allowing you to create options such as “value not set” or “all clusters in Asia”.

Grafana Cloud is the easiest way to get started with incident response and management. We have a generous forever-free tier and plans for every use case. Sign up for free now!

