The evolution of Grafana Cloud Synthetic Monitoring: new features, pricing updates, and more
With 2024 coming to a close, it’s a good time to reflect on how Grafana Cloud has evolved this year — and synthetic monitoring, in particular, is one area where we’ve really focused our efforts.
In May, we rolled out a revamped version of Grafana Cloud Synthetic Monitoring with the overall goal of making your monitoring processes not just more efficient, but more impactful. Synthetic Monitoring now enables you to emulate even the most complex transactions and user journeys so you can ensure the best possible end-user experience for your apps.
But we didn’t stop there. We’ve made a number of other updates since then to continue the evolution of Synthetic Monitoring, and help you get even more value out of the product.
In case you missed it, here’s a look back at the highlights.
Synthetic Monitoring: now better than ever, powered by Grafana k6
From the beginning, Synthetic Monitoring has used the Prometheus blackbox exporter to test at the protocol level. This worked well for health and uptime monitoring, but didn’t cover the full range of synthetic monitoring use cases.
To ensure system reliability, engineering teams today need to monitor and validate an increasingly intricate set of steps within the end-user journey. While we couldn’t offer this capability with the blackbox exporter alone, we can with Grafana k6.
The k6 performance testing platform has certain capabilities that perfectly suit synthetic monitoring use cases. These include:
- A high-performance JavaScript engine written in Go
- A scripting API designed to help emulate and test real application traffic
- Protocol support for HTTP, WebSockets, and gRPC
- Built-in metrics, with the ability to add custom metrics and logs to help with troubleshooting
These capabilities are exactly why we integrated k6 with the Synthetic Monitoring architecture earlier this year — a move that resulted in two new check types you can use today.
MultiHTTP and k6 scripted checks
HTTP checks have always been a core feature of Grafana Cloud Synthetic Monitoring, enabling users to test an HTTP endpoint to measure uptime and latency. These single HTTP checks are an effective way to perform basic health checks on a website or monitor the response time of a specific API endpoint.
In many cases, however, testing scenarios have become more complex. For example, they may have to verify multi-step API interactions or ensure data flows correctly between various parts of an application. This is where our two new check types — multiHTTP and k6 scripted checks — come into play.
- MultiHTTP checks: These checks let you test multiple URLs in a single check, while measuring uptime and response latency. Under the hood, a k6 script is generated, which means you don’t have to write code.
- k6 scripted checks: These checks give you the power and flexibility to define your workflow tests in JavaScript, using the k6 API to efficiently author tests.

Bonus: you can use these k6 scripts in other parts of the development lifecycle, which eliminates the need for teams to maintain separate testing scenarios. For example, the same script used for Synthetic Monitoring could be used by developers in a CI pipeline to test for regressions.
A streamlined UI
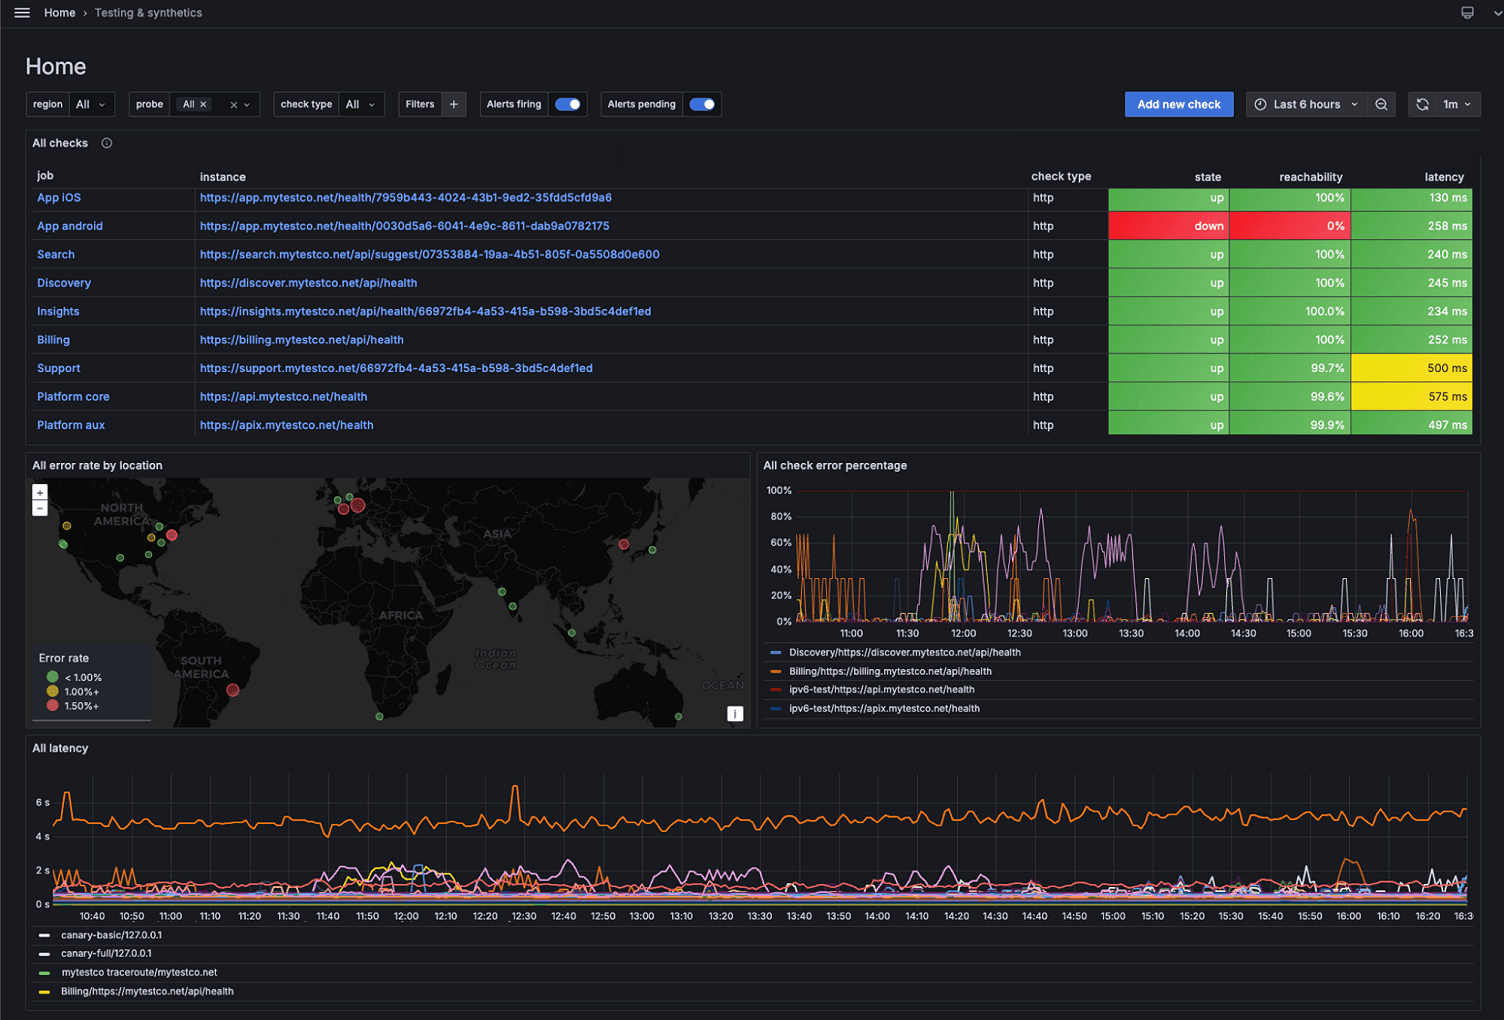
We’ve also been making iterative changes to the Synthetic Monitoring UI, many of which you’ve probably noticed already. We want to make setting up and understanding your running checks a breeze, so we’ve improved the check creation flow, updated lists of probes, and made the dashboards for checks more error-driven.
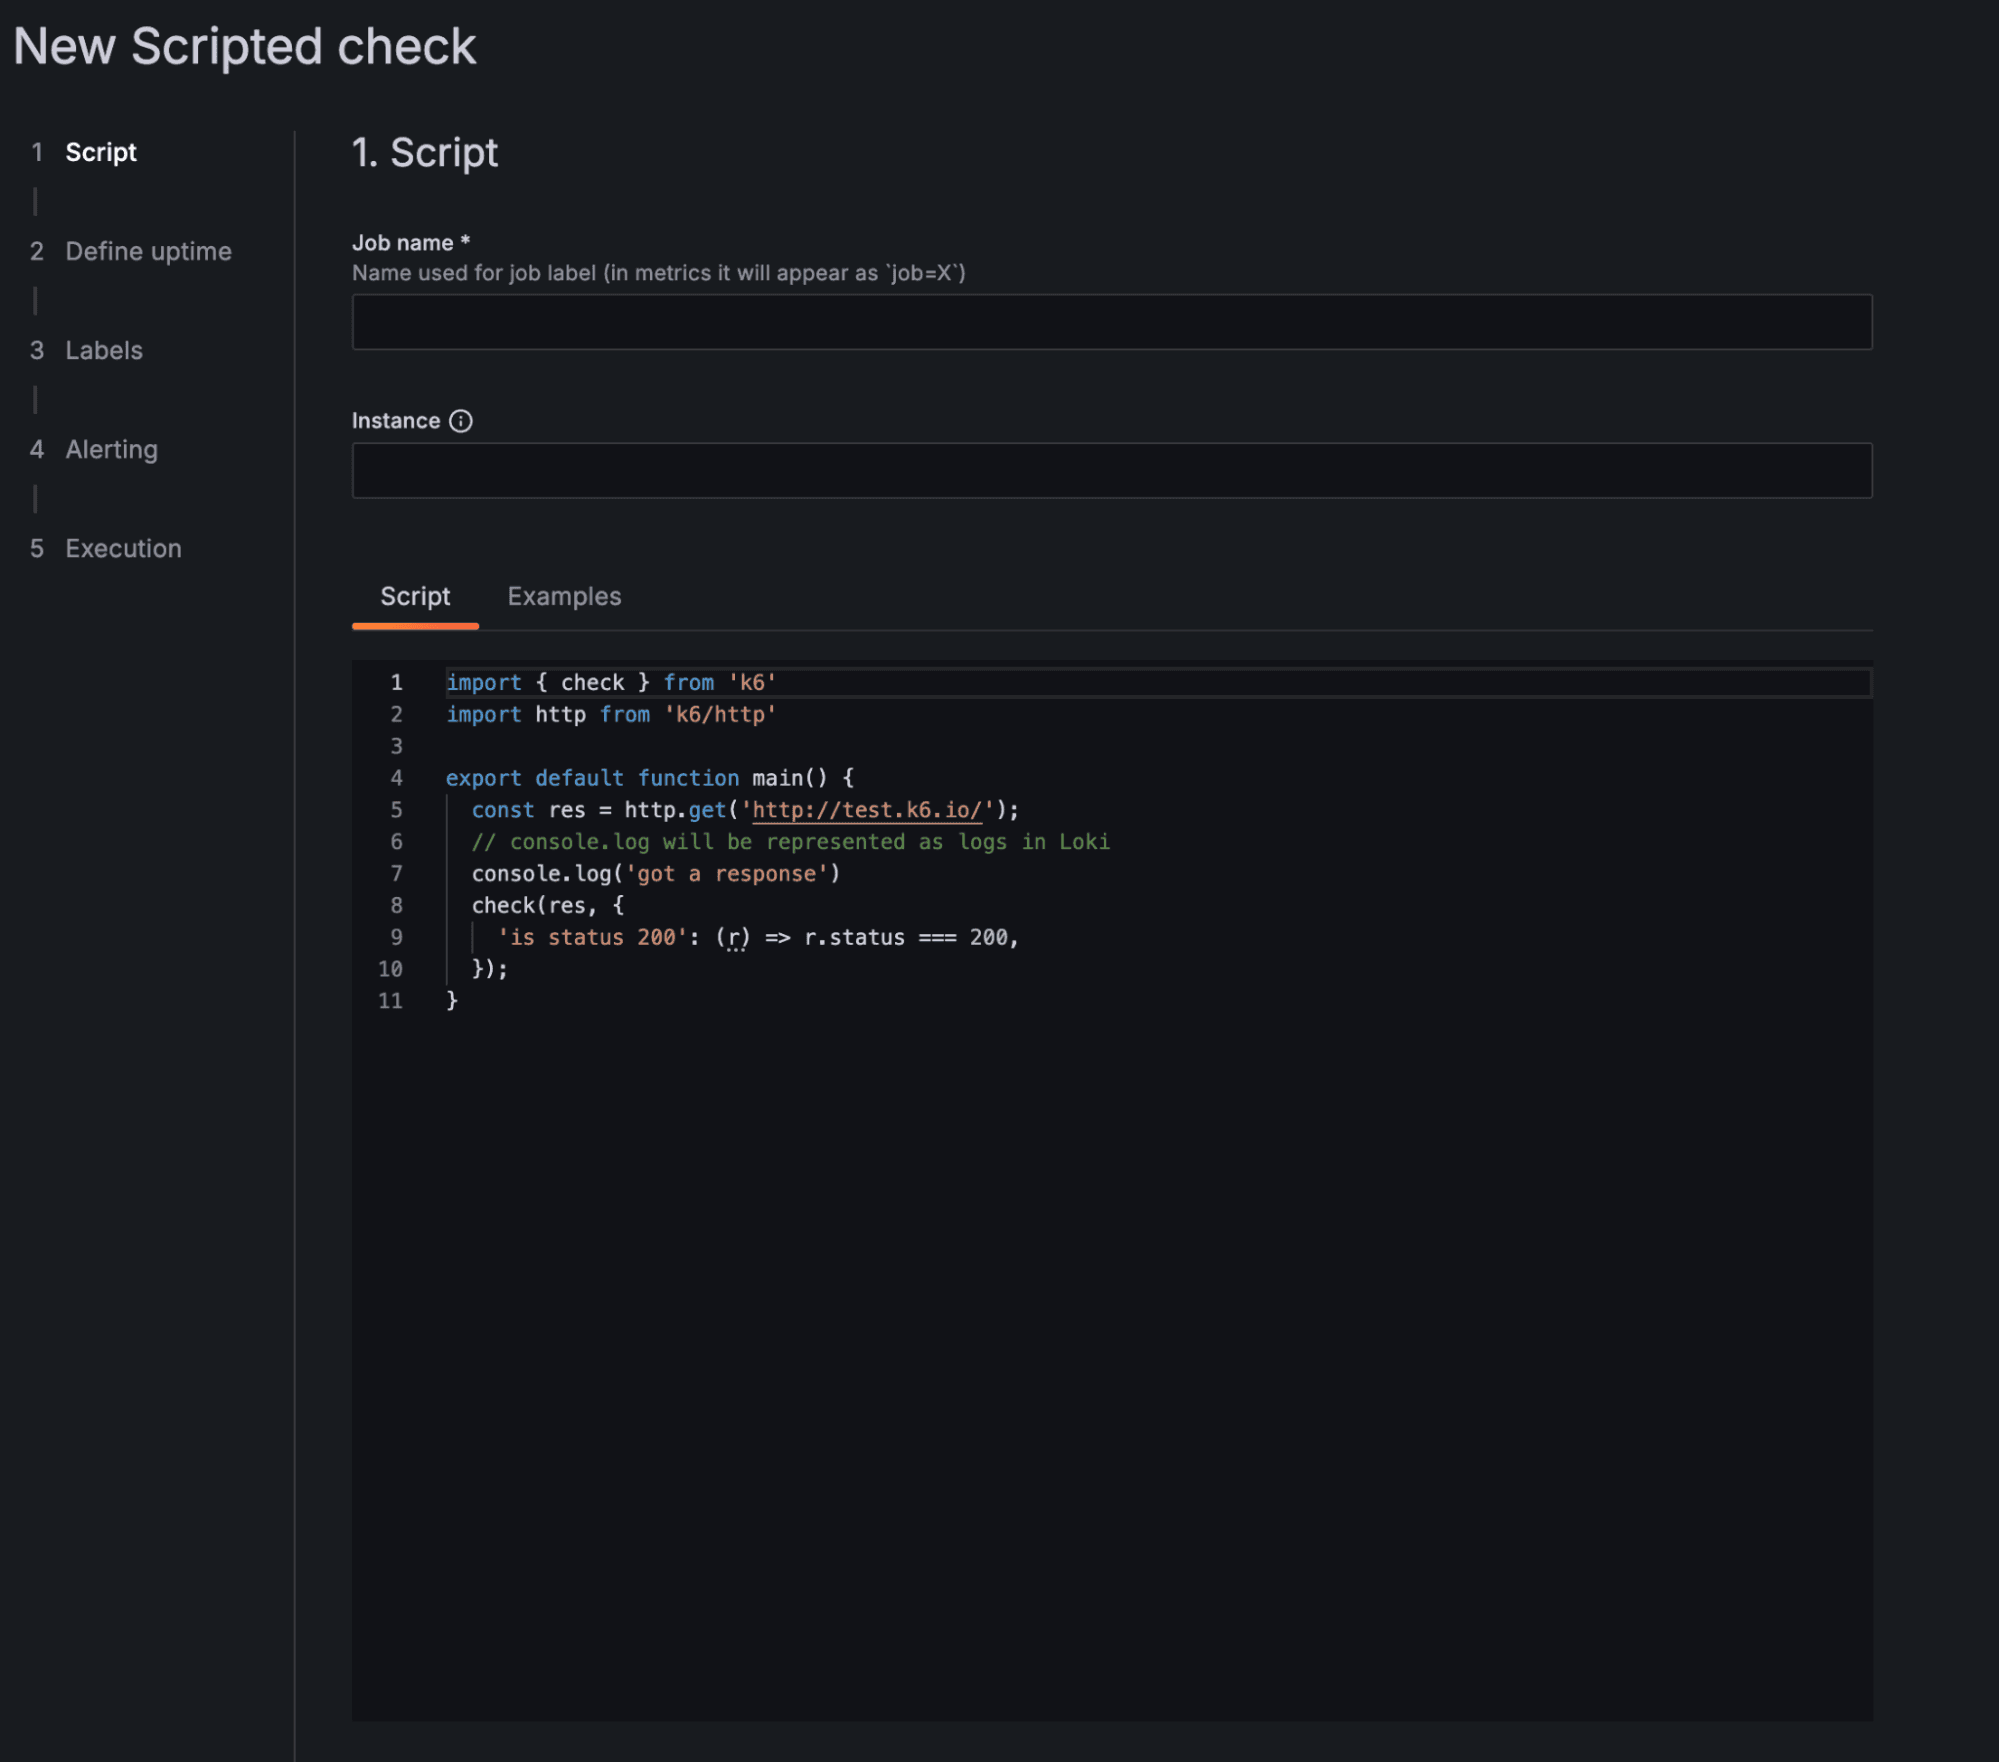
We’ve condensed the in-app check creation flow to five simple steps, as shown in the screenshot below.

New pricing for Synthetic Monitoring
Alongside these enhancements, we’ve updated our Grafana Cloud Synthetic Monitoring pricing model.
Synthetic Monitoring has transitioned from a telemetry-based pricing model to an execution-based model. This means pricing is now based on the number of executions your checks run each month.
The change reflects our investment in the product itself and the value provided to our customers, and matches how other Synthetic Monitoring products on the market are priced.
Note: an “execution” is defined as one minute of synthetic check runtime multiplied by the number of locations used. We are including 100k executions per month in our Cloud free tier.
Optimize your Synthetic Monitoring spend
If you’re an existing customer impacted by this pricing change, we’ve reached out via email over the past few months. Please check your inbox and contact customer support, so we can walk you through the changes and help you optimize your spend.
We also recommend you evaluate your Synthetic Monitoring configurations, as noted in the following points, to reduce costs:
- Review your usage: You can review usage on the Billing and Usage dashboard on the Synthetic Monitoring Usage Details panel. You also can configure usage alerts from the panels displayed on the Billing and Usage dashboard to notify your team when activity exceeds expected levels.
- Reduce execution frequency: The easiest and most effective way to cut costs is to reduce the frequency of your check executions. Unless you require high-frequency monitoring, changing from once per minute to once every five minutes reduces costs by 80% with minimal loss of fidelity.
- Use fewer probe locations: For most use cases, we recommend using three public probes. If you are using more than three probes, you should have a unique use case that supports that need — otherwise, you can reduce your number of probes to cut costs. For example, going from six probes to three probes would lower your costs by roughly 50% with minimal impact.
To learn more about these and other optimization techniques, please refer to our documentation.
We look forward to hearing your feedback, and to the continued evolution of Synthetic Monitoring in 2025.


