Reduce mean time to hello world with OpenTelemetry, Grafana Mimir, Grafana Tempo, and Grafana: Inside Adobe’s observability stack
How is Grafana like an invisibility cloak?
At Adobe, it’s one of just four tools they’re using to build observability directly into their CI/CD pipeline, making it essentially invisible — but nonetheless impactful — to thousands of developers across the organization who use it in their day-to-day lives.
Utilizing OpenTelemetry, Grafana, Grafana Mimir, and Grafana Tempo, the Adobe team has adopted a flexible and open observability strategy that reduces mean time to hello world for their developers while also delivering prebuilt dashboards in Grafana.
In their recent ObservabilityCON 2022 talk titled “Observability strategy at Adobe with OpenTelemetry, Grafana, Mimir, and Tempo,” Senior Manager of Observability Sachin Garg and Senior Manager of Software Development Chris Featherstone shared the three principles that drive their observability strategy and showed how their developers can spin up Grafana dashboards to monitor performance and track SLOs in less than five minutes.
Seamless observability across three clouds and 26,000 employees
Adobe has tens of thousands of employees working across 35 countries on projects in their three clouds: Adobe Creative Cloud, Adobe Document Cloud, and Adobe Experience Cloud. With so many distributed developers working on such diverse and business-critical projects, a seamless approach to observability is critical to the team’s success.
In 2018, they were using a broad number of primary and specialized tools across their observability landscape. “We had about 20 tools being used all over the place,” said Garg. “We centralized the team and started looking at each and every tool, moving toward a hybrid strategy.” Today they have consolidated to four tools, with Grafana representing the largest use case among them.
Garg shared three key principles that drive Adobe’s modernized observability strategy:
- Leverage open standards where possible. “You have to be flexible and do data collection in an open way. Then you can switch the backend around based on who’s doing best at that point in time.”
- Focus on developer productivity — not onboarding. “As part of their CI/CD process, [developers] should seamlessly be able to onboard to observability.”
- Create a consistent observability experience. “By integrating observability tooling into our incident and developer workflows, we can give fast feedback to our developers.”
These principles led them to a push-button Grafana deployment that allows countless teams across Adobe to easily display metrics and traces collected via OpenTelemetry and stored in Grafana Mimir and Grafana Tempo.
Building Grafana dashboards in five minutes or less
Featherstone then took to the stage to demo how quickly their developers can spin up Grafana dashboards to access their own monitoring data and visualize SLO metrics — without any manual assistance from Featherstone’s team.
Even with more than 500 Grafana instances running, “my team doesn’t get called at all,” he said. “The metrics are already being sucked in, so teams that know nothing about Kubernetes, Grafana, or even Mimir can get some kind of metric without even picking up the phone.”

Default dashboards showcase everything from Kubernetes namespace metrics to SLOs.
Featherstone’s team can also build deep dive dashboards that visualize metrics and traces collected via OpenTelementry and stored in Grafana Tempo.
“We tested four or five different backends for traces: Cassandra, Elasticsearch, OpenSearch, and vendored solutions,” said Featherstone. “We landed on Tempo because our target is 1 million samples per second. We tested Tempo right up in that range.”
With the flexibility that Tempo provides, Featherstone can create a dashboard like the one below, which visualizes metrics and traces for an Adobe Java image running in Kubernetes. And with exemplars natively enabled in these dashboards, users can simply stay within Grafana, get a detailed view of each trace (including the traceID and three spans), and then have the option to drop down into more details contained in the related metrics and logs as well.
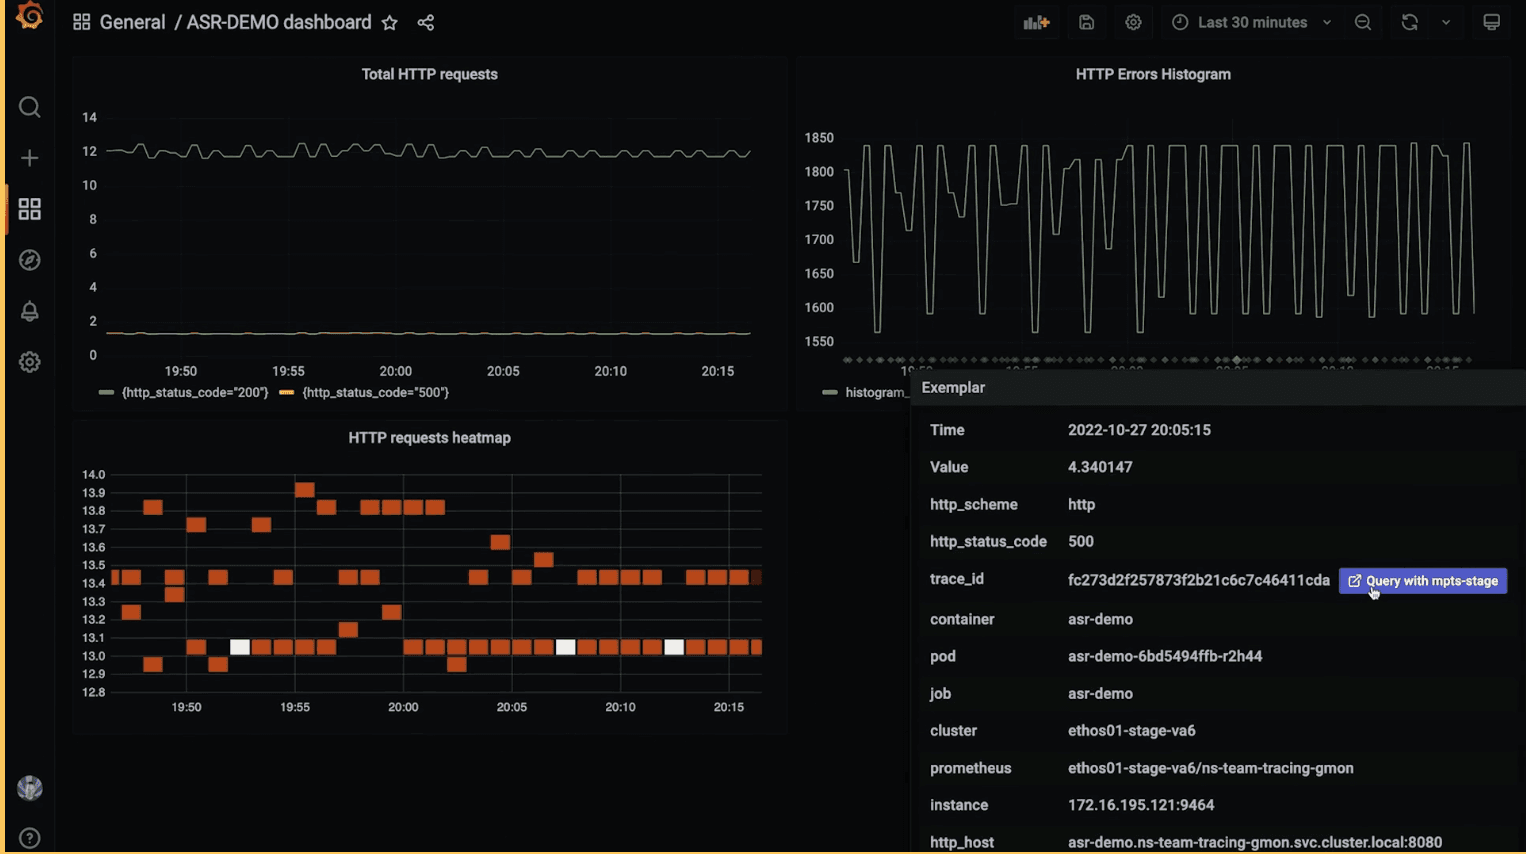
All of this makes for a frictionless, invisible observability process that is easy for developers to utilize. “I want [our engineers] to think more about feature development and less about observability,” said Featherstone. And with Grafana, that’s exactly what they can do.
Watch the full ObservabilityCON session to see how Adobe is building a dashboard that delivers a “Kevin Bacon” view that correlates metrics, traces, logs, profiling, and more. All our sessions from ObservabilityCON 2022 are now available on demand.

