
How to monitor Windows logs with the updated Windows integration for Grafana Cloud
As we all know, Windows is one of the most popular operating systems in the world. It has a dominant share in the desktop computer market, with more than 70% of the machines running the operating system. It makes sense, then, that the Windows integration is also one of the most used and popular integrations in Grafana Cloud.
We’re excited to announce that we have made some updates to our Windows integration for Grafana Cloud, which is available now to all Grafana Cloud users, including those in our free forever tier. In addition to monitoring Windows metrics, the integration now supports monitoring Windows logs through the event log scraping capabilities of the embedded promtail module in the Grafana Agent.
Let’s walk through how to quickly set up a Grafana Cloud account so you can begin monitoring your Windows machines!
Get started with the Windows integration in Grafana Cloud
You can configure the Windows integration in Grafana Cloud in three easy steps:
- Open up your Grafana Cloud account. (Grafana Cloud is required to use the integration, so if you don’t already use it, sign up for a free account now.)
- In your Grafana instance, click Integrations and Connections (look for the lightning bolt icon), then click on the Windows tile to install the integration.
- Follow the steps to set up and install the Grafana Agent on your Windows machine to start sending metrics and logs to your Grafana Cloud instance.
Using Grafana for monitoring Windows
After the Windows integration is installed, you will see two prebuilt dashboards installed that are specifically designed to monitor Windows metrics and logs.
Grafana dashboard for Windows overview metrics
The Windows overview dashboard provides a general overview of the Windows machine’s metrics.
From the drop-down menu, you can filter the Windows metrics by the following labels:
- Job: the job name set for the Windows integration
- Hostname: the hostname of the server being scraped by the Grafana Agent
The dashboard shows important metrics reported by the Windows machine such as:
- System uptime
- CPU statistics
- Memory statistics
- Disk usage
- OS information
- Network usage
The reported metrics can also be aggregated when multiple machines are being monitored.

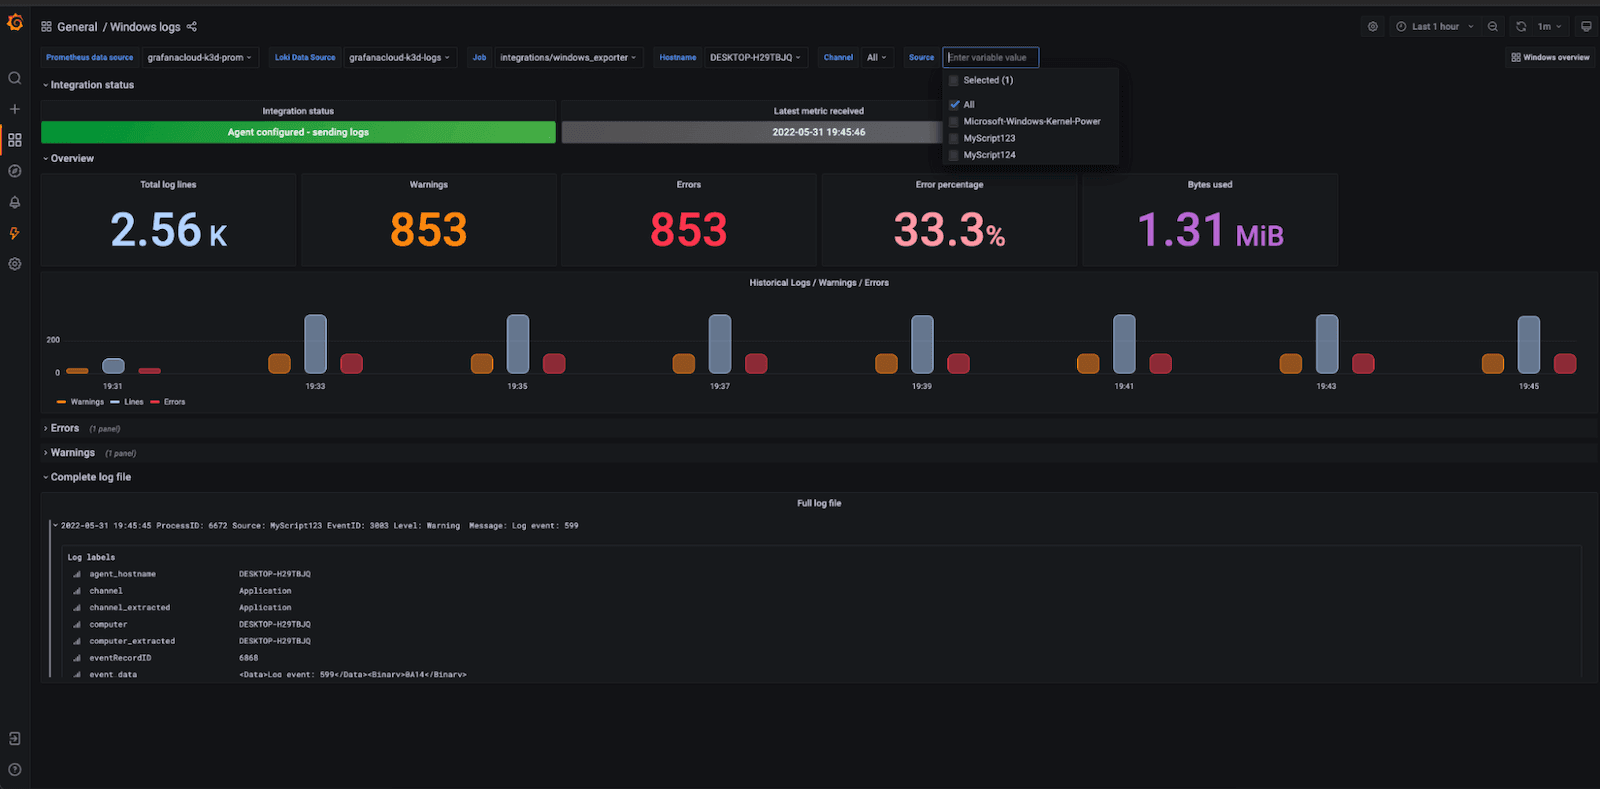
Grafana dashboard for Windows logs
The Windows logs dashboard provides aggregated statistics of collected Windows log events. It can also be used to view individual Windows log events. The Grafana Agent uses the embedded promtail module to scrape Windows event logs and parses them to generate labels based on the different fields present in the log event.
From the drop-down menu, you can filter the Windows logs by the following labels:
- Job: job name set for the Windows integration
- Hostname: the hostname of the server being scraped by the Grafana Agent
- Channel: the Windows event log channel — system or application
- Source: the source which generated the specific log event, which is usually the application name or the service name
The Grafana dashboard for Windows logs contains useful information about the collected log events such as:
- Total number of log events
- Number of errors and percentage
- Number of warnings and percentage
- The total size of the log events collected
- Raw log events filtered by errors and warnings, as well as all log events
Learn more about the Windows integration for Grafana Cloud
For more information, check out the Windows integration documentation. If you give the integration a try, let us know what you think! You can reach out to the team in the #Integrations channel of the Grafana Labs Community Slack.
Grafana Cloud is the easiest way to get started with metrics, logs, traces, and dashboards. We have a generous forever-free tier and plans for every use case. Sign up for free now!

