
ObservabilityCON 2021: Your guide to the newest announcements from Grafana Labs
This morning during the ObservabilityCON keynote, we announced some of the exciting projects and feature enhancements we’ve been working on for our customers and community.
And it doesn’t end there. Throughout the week, we’ll continue to unveil new features, go deeper with live demos, and share our plans to shape the future of observability. With so many new announcements and features to check out, we want to make sure you know where to get more details about these developments. Here is your guide to all of the newest announcements from Grafana Labs.
Grafana OnCall for better on-call management
One of the most exciting announcements made during the keynote is the beta preview for Grafana OnCall, an easy-to-use on-call management tool available in Grafana Cloud. Born from Grafana Labs’ recent acquisition of Amixr, Grafana OnCall is built to help DevOps and site reliability engineering (SRE) teams reduce toil in on-call management through simpler workflows and interfaces tailored for devs.

With Grafana OnCall, teams will no longer have to manage separate alerts from Grafana, Prometheus, and Alertmanager, lowering the risk of missing an important update while also limiting the time spent receiving and responding to notifications. OnCall is easily integrated into existing Grafana Cloud deployments, working with existing alerting sources and monitoring tools so that teams can get up and running quickly and easily.
OnCall includes key features such as customizable escalation policies, advanced routing policies, a Google Calendar-based workflow, integration with Slack, automated grouping, and more. Read the blog to get more details and watch the demo to see OnCall in action. To get started, sign up for a free Grafana Cloud account and check out the documentation to learn how to set up OnCall in just a few minutes.
Grafana OnCall is available in preview beta for Grafana Cloud customers using the Free, Pro, and Advanced tier.
More secure traces with Grafana Enterprise Traces
Grafana Enterprise Traces (GET) completes the last piece of the enterprise stack. In the same way that Grafana Enterprise, Grafana Enterprise Metrics, and Grafana Enterprise Logs take everything you love about Grafana, Cortex, and Loki and turn them into products suitable for running at large organizations, we’re completing the picture with Enterprise Traces based on Tempo.
Just like Grafana Tempo, GET is built on a unique approach to trace indexing, storage, and administration control that allows companies to run it securely at scale. Everyone in an organization can access all of their relevant trace data, and companies that have specific security policies or are in regulated industries can leverage the built-in Grafana interface to easily manage permissions and settings and grant individuals access to the resources they need without compromising cost.
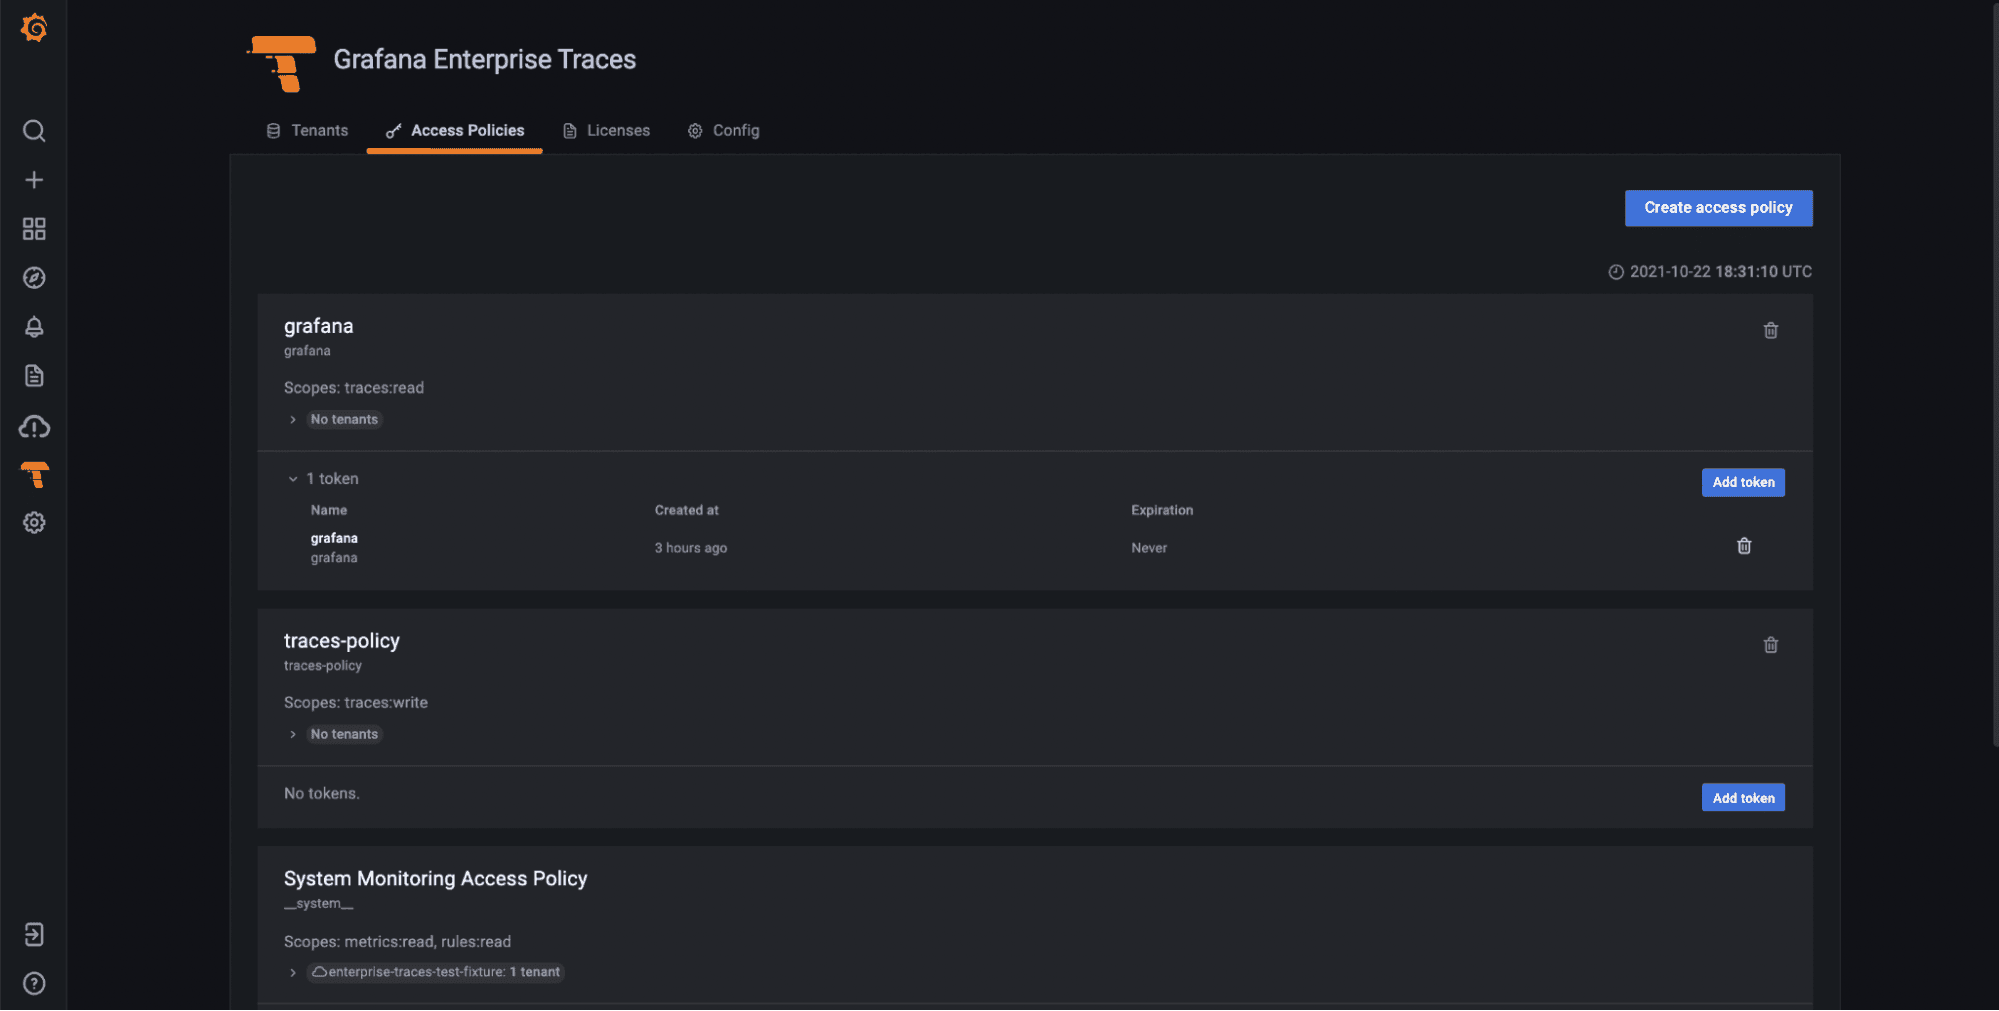
To learn more about Grafana Enterprise Traces, watch the demo and read the announcement blog post. If you’re ready to get started with GET, check out the documentation or you can reach out directly to our team.
Tempo 1.2 makes monitoring traces 2x more efficient
The release of Grafana Tempo 1.2 delivers the first version to support search, a scalable single binary deployment, increased efficiency, and more. Here are some highlights:
- Recent traces search allows you to natively search Tempo for traces that are still in the ingesters. Traces can be searched for data originating from a specific service, duration range, and span and process-level attributes included in your application’s instrumentation, such as HTTP status code, customer ID, etc.
- The new scalable single binary that allows for a horizontally scalable single binary that contains every component. The components continue to act as if they were in a fully distributed setup (i.e., every distributor pushes to every ingester), but since they are packaged as a single binary it can reduce operational burden.
- Tempo 1.2 is the most performant version of Tempo ever released. The following graph shows bytes received over total Tempo CPU usage. It is roughly a measure of the efficiency at which Tempo ingests, organizes, and queries traces.

Check out our session all about distributed tracing at ObservabilityCON where our team will do a deep dive on Grafana Tempo. Also be sure to review our documentation.
If you’re not using Grafana Tempo yet, the easiest way to get started is with Grafana Cloud. Our free tier includes 50GB of traces and only takes a few minutes to get started. You can sign up for free here.
Loki 2.4 released
Loki 2.4 is all about making Lokieasier to run. We’ve built a new three-service deployment model to enable Loki operators to set up a high-availability, scalable log cluster faster than ever before, with a particular focus on enabling non-Kubernetes setups.
Besides this, Loki 2.4 also includes support for OOO log lines, custom log retention policies per log stream and per tenant, and a deletion API that makes it easy to scrub log data you don’t want to keep around. Don’t worry — we haven’t saved all the fun features just for Loki operators. We also have countless improvements to the Loki log panel and Explore views to make it easier than ever to navigate logs in Grafana.

To learn about all of the new features available, the Loki team will walk you through a complete demo during ObservabilityCON. You can also check out all of our Loki documentation.
The easiest way to get started with Loki is with Grafana Cloud. Our free tier includes 50GB of logs and only takes a few minutes to get started. You can sign up for free here.
Recorded queries turn “point in time” data into a time series
Recorded queries allow you to export the results of certain non-time series queries to the Enterprise backend in order to store data over time and allow customers to construct their own time series.
This new feature is especially helpful for our Enterprise customers using plugins because many of our new plugins, like ServiceNow and Jira, don’t return time series so customers weren’t able to plot historical data over time. With recorded queries, now they can!

You can tune into our ObservabilityCON demo to learn more about recorded queries.
Out-of-the-box dashboards and alerts
AWS CloudWatch integration
The CloudWatch Metrics integration is a managed service that allows you to automatically pull metrics from AWS CloudWatch into Grafana Cloud with a few simple clicks and get access to prebuilt dashboards, alerts, and blazing fast queries at no extra cost.
Compared to other solutions, you don’t need to install any additional components with this integration: We manage all the infrastructure needed to connect to the CloudWatch API, fetch metrics data, and store them into Grafana Cloud.
Our systems will request metric data from the CloudWatch API every few minutes and convert them into Prometheus metrics. These metrics are then stored into our Prometheus-compatible backend alongside all other Grafana Cloud metrics, all in one place. This means that once the metrics are stored into Grafana Cloud, they can be queried at no extra charge using the PromQL language and you can benefit from the long-term retention, reliability, and performance of our managed Prometheus backends.
This integration doesn’t charge extra for custom metrics and queries are completely free. Just pay for the data you ingest, period.
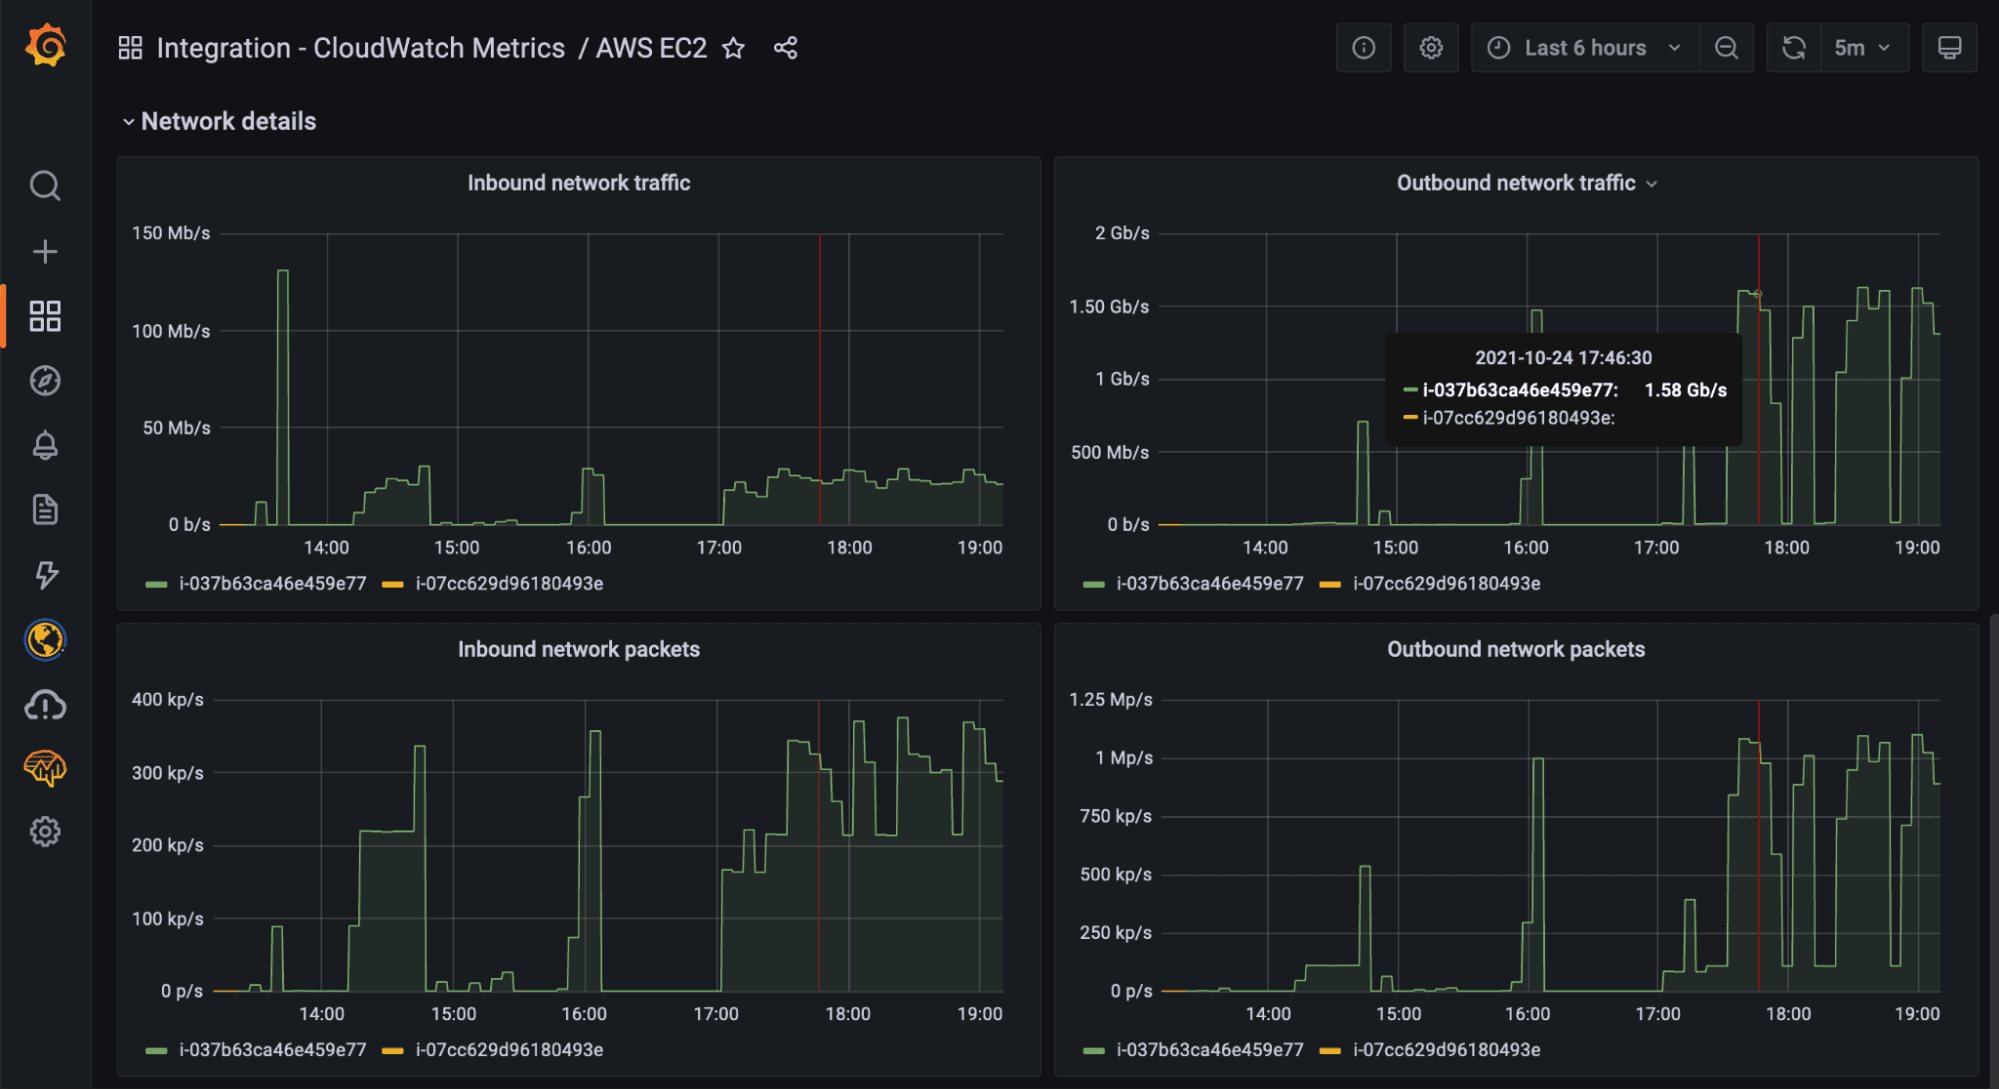
Learn more about our AWS CloudWatch integration in the ObservabilityCON session and refer to the docs.
Kubernetes integration
Back in May, we announced the Kubernetes integration to help users easily monitor and alert on core Kubernetes cluster metrics using the Grafana Agent, our lightweight observability data collector optimized for sending metric, log, and trace data to Grafana Cloud. Since then, we’ve made some improvements to help our customers go even further. For more information, refer to our documentation.
Better metric collection via the Grafana agent
One of the key improvements we’ve made is to the agent. Previously, configuring scrape endpoints like kubelet and cadvisor was both time-consuming and error-prone, so we wanted to make this easier. Now users can easily monitor and alert on core Kubernetes cluster metrics using the Grafana Agent, our lightweight observability data collector optimized for sending metric, log, and trace data to Grafana Cloud.
Easy one-click configuration
Users can now use the guided configuration through the integrations wizard which makes it easier to get started and includes Helm charts. There are also additional instructions for in-progress data sources and to create an allow-list for metric types. This is currently being done with manual edits to config snippet, but we hope to also make this easier in the future so stay tuned for even more configuration improvements

OOTB dashboards based on your metric needs
The Kubernetes integration is packaged with pre-built dashboards and alerts — including six dashboards from the original Kubernetes mixin. After configuring the Kubernetes integration, you’ll be guided directly to content that is relevant to you.

Be sure to watch the full walkthrough of our Kubernetes capabilities and learn best practices for getting started.
WSO2 Enterprise Integrator
The WSO2 Enterprise Integrator (WSO2 EI) integration runtime engine can play multiple roles in your enterprise architecture. It can act as an ESB, a streaming data processor, and a microservices integrator. Deployment options include on-premises, Cloud, hybrid, or a container orchestration platform of choice.
The integration is composed of five dashboards that provide the following information:
- Node Metrics display node-specific information, including JMV-related data and the list of resources deployed in the node, as well as request-related metrics.
- Cluster Metrics display a cluster overview, including which nodes it is composed of and the list of resources deployed in those nodes, as well as request-related metrics.
- API Metrics display deep dives of specific APIs, which can be deployed in multiple nodes.
- Proxy Service Metrics display deep dives on specific Proxy Services, which can be deployed in multiple nodes.
- Inbound Endpoint Metrics display deep dives on specific Inbound Endpoints, which can be deployed in multiple nodes.
You can reference the docs to get the WSO2 Enterprise Integrator integration today.
If you’re not already familiar, Cloud integrations include a curated set of default metrics, preconfigured Grafana dashboards and alerts, driven by the Grafana Agent deployed into your environment. As a result, Cloud integrations abstract away all of the work previously required to configure, install, connect, and maintain any services you wanted to monitor in Grafana. See Install and manage integrations to learn how to use integrations. And check out the list of Currently available integrations.
Improved analysis for high cardinality data
One of the pains we hear over and over again from customers is the challenge of reasoning about the cost, cardinality, and usefulness of the data they’re sending into their observability systems. Which is why we built our new cardinality analysis tool, which tackles this problem by enabling users to quickly drill into their Prometheus metrics data with pre-built dashboards that help answer questions like:
“How many series are associated with a given metric?”
“For a given label, what is the distribution of values across all time series?”
“For a given metric, what is the label value count for each label?”
The results? Users are enabled to optimize cardinality and minimize costs.
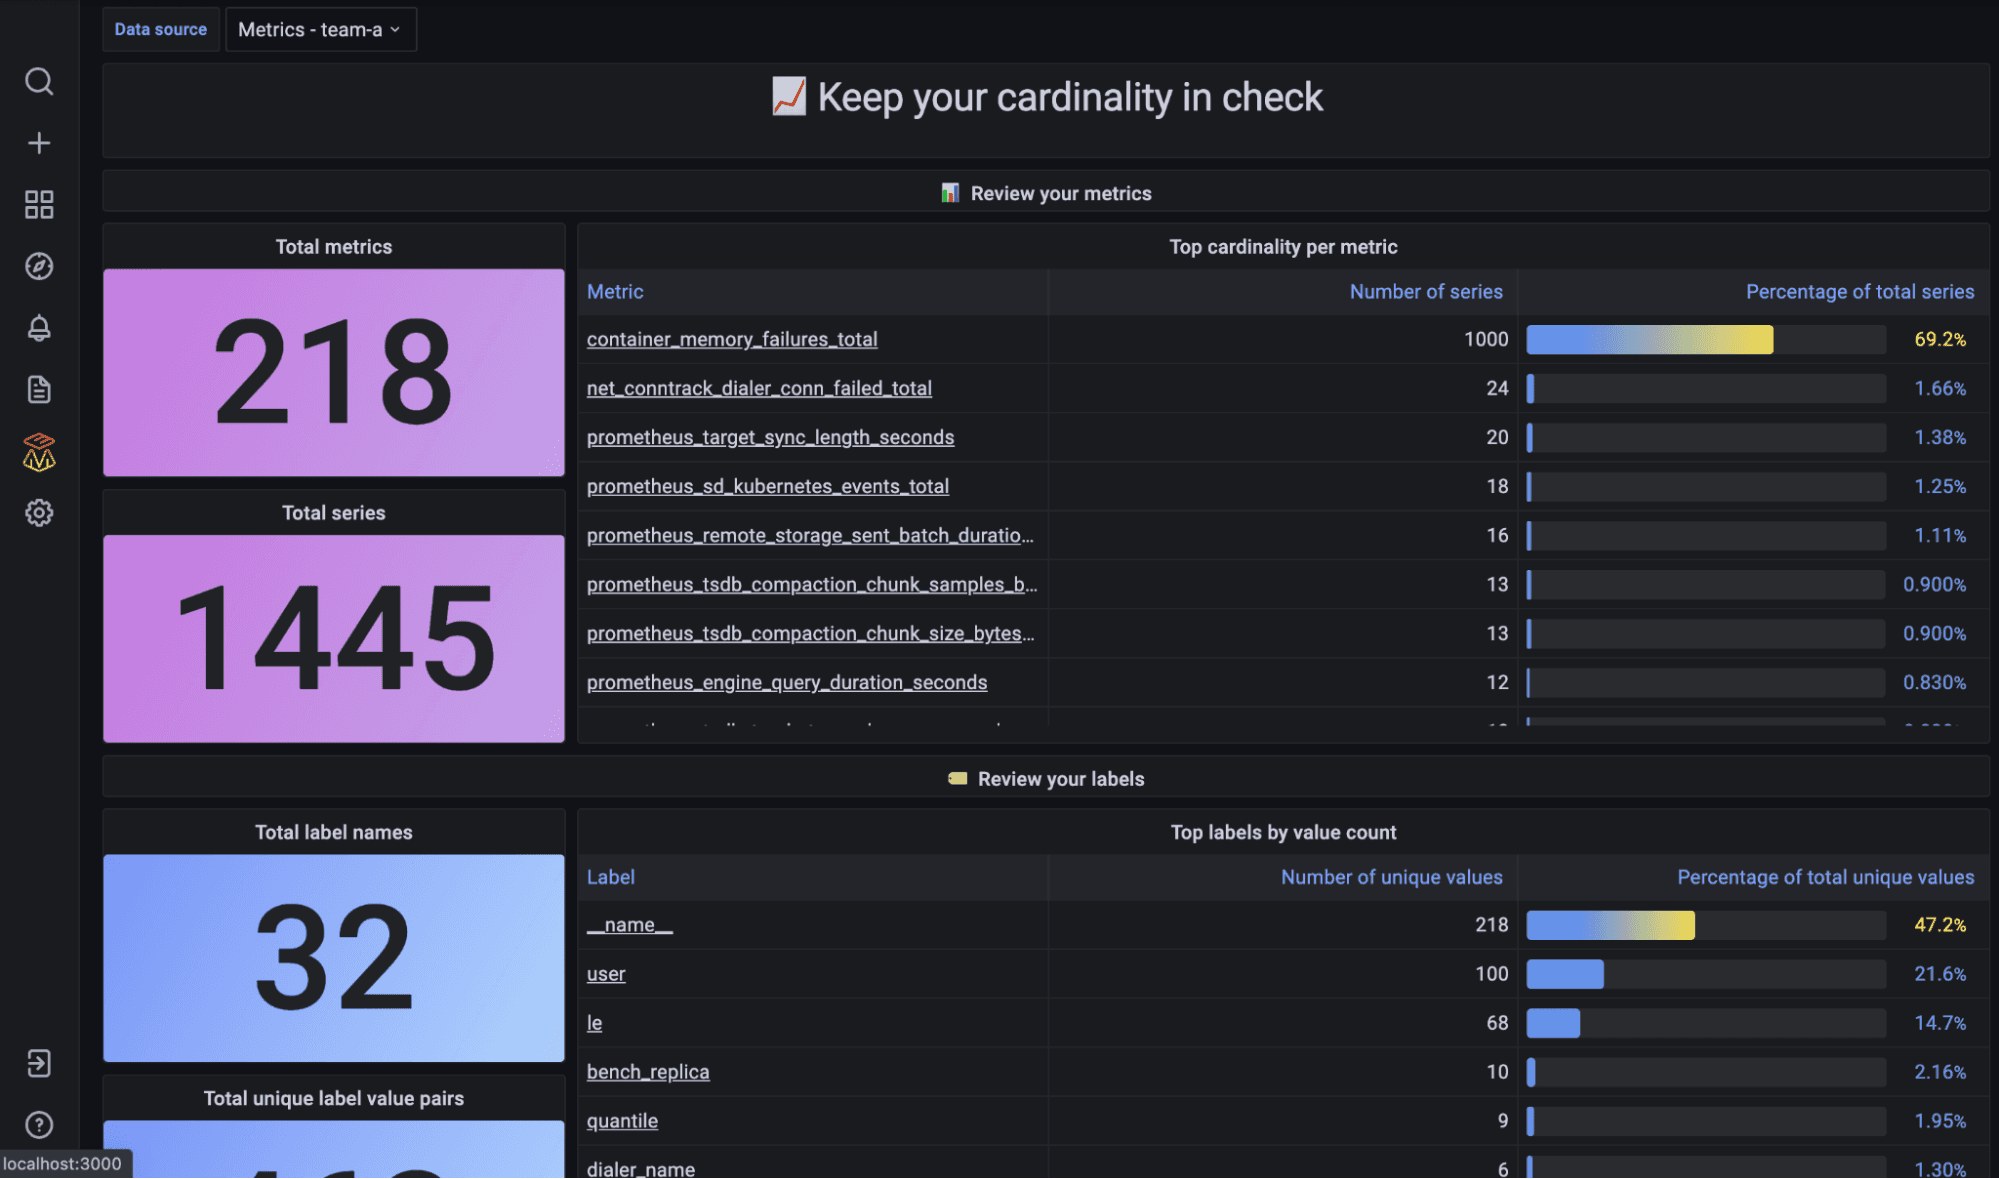
You can learn more about cardinality analysis by watching the demo from ObservabilityCON.
Query sharding for 10x faster queries
Query sharding radically reduces the time required to execute high cardinality metrics queries, allowing you to more quickly troubleshoot potential incidents and investigate high cardinality data in ways previously not possible.
For example, here we picked a medium cardinality query, a query that touches 80K series over the last six hours. You can see an improvement from 38 seconds to 4 seconds.

To get the benefit of query sharding, especially with 100s of millions of metrics, you’ll need to be using Grafana Enterprise Metrics (our on-prem version) or Grafana Cloud Metrics. To get started, you can sign up for Grafana Cloud for free.
To see more examples of how you can get 10x faster queries, watch the demo video from ObservabilityCON.
k6 + Grafana are now better together
Update: Grafana k6 load and performance testing is now available natively in Grafana Cloud. Existing k6 Cloud customers will not be impacted; they will be migrated to the new experience at a later date. Get started with Grafana Cloud k6 →
Following the June 2021 acquisition of k6, we’re happy to announce some new capabilities for k6 that will showcase its flexibility as a testing tool and help you improve application performance, reliability, and stability.
k6 <3 Prometheus
k6 Cloud has offered Prometheus support for a while now, and we felt it was high time to extend that support to our open source solution. k6 OSS has supported sending k6 metrics to multiple outputs such as InfluxDB, New Relic, StatsD, etc. But until now, Prometheus was absent from that list, despite its success and being the standard to store metrics in cloud native projects like Kubernetes.
As of today, you can use the xk6-output-prometheus-remote extension and have official support for your Prometheus when testing with k6 OSS.
Browser automation and end-to-end web testing
We’re also excited to launch xk6-browser: an extension to k6 adding support for browser automation via the Chrome Devtools Protocol (CDP). This public beta release of xk6-browser extends the possible use case beyond what is supported by the existing protocol-level capabilities. From a test authoring and scripting perspective this means that you can script in terms of user actions (navigations, mouse and keyboard actions, taking screenshots, etc.) rather than by making HTTP requests, WebSocket messages, etc. This has advantages and improved the developer experience in use cases where scripting using protocol-level APIs would be cumbersome, fragile, and difficult to maintain.
With xk6-browser, you can interact with the browser to test your web applications end-to-end while accessing all of the k6 core features, including protocol-level APIs and other k6 extensions. A single tool for both protocol and browser-level testing.

Check out the ObservabilityCON talk where our k6 team will show you these new features. You can also learn more by reading the documentation and GitHub repository.
Start observing with Grafana
You can check out all the ObservabilityCON 2021 sessions for information about all the new features we’ve announced. And if you’re not already using Grafana, get started for free today!

