
Intro to distributed tracing with Tempo, OpenTelemetry, and Grafana Cloud
I’ve spent most of my career working with tech in various forms, and for the last ten years or so, I’ve focused a lot on building, maintaining, and operating robust, reliable systems.
This has led me to put a lot of time into researching, evaluating, and implementing different solutions for automatic failure detection, monitoring, and more recently, observability.
Before we get started: What is observability? Observability is the practice of taking an opaque system, or action in a system, and making it available for us to inspect and reason about through its outputs.
For instance, consider an interaction from a user that results in an order being placed through the orders API. If that order placement goes south, to what degree are we able to debug and troubleshoot that? Are we able to see and follow the trace left by the interaction, read through the logs, or analyze metrics to deduce what happened?
In a classic monolithic application, this would be fairly simple — at least as long as we stay in a non-production environment, usually enabled to allow us to attach a debugger and maybe even put in breakpoints to step through the logic as we wish. In production, this would be harder, given that we seldom (and for good reason) keep debugging enabled as we release software used by the end user.
While cumbersome, this worked quite well for these monolithic systems. However, as the pace of delivery increased, systems started to become more and more distributed to support this new way of working, where multiple teams would release parts of a system independently of one another.
Monoliths vs. distributed systems
Let’s take a look at an example of how a request to a monolithic system would look. It’s quite straight forward, and the control flow passes from one method to another, crossing multiple classes as it travels toward completion. We get a coherent stack trace, and by only adding logging, we would get at least a decent grasp of what is going on and why.
Now let’s take a look at the same system, but implemented as a distributed system using microservices. Here, each microservice — or lambda function if you’re really pushing the envelope — could be delivered by a different team or person. The components in this architecture are loosely coupled, constrained only by runtime expectations of the messages or interactions between them.
This architectural style also means there is no overarching process binding the services together. Instead, they’ll all be run as their own separate little applications, maybe even replicated across multiple copies, across multiple data centers or even different geographic regions.
The once-straightforward way of debugging is now no longer an option. There is no longer any obvious correlation between the calls of each service, and trying to piece them together using, for instance, timestamps or other metadata will soon grow unmanageable. In a system with as few as 10 requests per second, the manual labor would be overwhelming, and we’d likely get it wrong more often than not.
Imagine if we scale that up to 10,000 requests per second, or a million. What if multiple calls to the exact same method occur with just nanoseconds between them? It just won’t scale.
So how would we remedy this? This is where observability comes in.
The three pillars of observability
When people talk about observability, it’s common to hear them refer to the three pillars of observability: metrics, logs, and traces. While not magically making a system more observable, paired in the right way, these three make up a somewhat complete stack of techniques for inspecting what’s going on inside a system.
Traces
While all three are important parts of making a system more observable, this article will focus on the third pillar: traces. Tracing, or in this case distributed tracing, is an attempt to solve the loss of coherence in distributed systems.
We do this by instrumenting our system, making runtime information available as part of our traces. Things like local scope variables, stack traces, and logs all get added to the trace as timestamped data for external analysis.
This may add a performance overhead to our system, but for most teams, the convenience of being able to analyze the system state far outweighs any performance penalties.
When to use
Should we always default to adding distributed tracing to our applications? Not necessarily. If we’re already able to reason about the internals of our system in a satisfying way, there might be other activities available that would bring more value to the team or the product.
However, if we currently feel that we lack the means to do any of the following, then distributed tracing might be just what we need to:
- Easily see the health of the services part of this system.
- Find the root cause for errors and defects that surface in production.
- Find performance issues and pinpoint where and why they occur.
How tracing works
So how does this work in practice? Well, first off, we need some way to track what microservice calls belong to what trace. We do this by adding metadata to the request context, which we’ll pass on with each subsequent call, allowing them to form a coherent trace that we then may search and analyze using, for instance, a trace or span ID.
I hope you’re all still awake. I promise we’ll soon get to the fun parts, but prior to that, we just need to talk a little bit more about what makes up a trace.
As there is more than one format for traces, as well as for how they propagate context, there might be slight differences to the building blocks of a trace depending on which format you choose.
For this article, we’ll make use of the OpenTelemetry project for tracing, context propagation, and exports. In general, these concepts will hold true for most other tracing implementations as well.
So, let’s start from the top. We are tasked with setting up tracing for the hypothetical company DogBook. One of our users, Floor, is trying to fetch a list of kennels as well as the dogs that live there using our API, in this case, /api/v1/kennels.
As her request is processed by the kennels endpoint, a root span is created. This span will contain timings for the full request, end-to-end. It will also serve as a container for all other spans created as part of the request.
For each subsequent operation, additional spans will be created and nested underneath their parent span. So in our example, the root span is created as the request reaches api/v1/kennels, and then, as we ask the kennel microservice for a list of kennels, another span will be created.
When the kennel microservice asks the dog microservice for the name of the dogs in that particular kennel, a third span will be created, and so on, forming a causal relationship model.
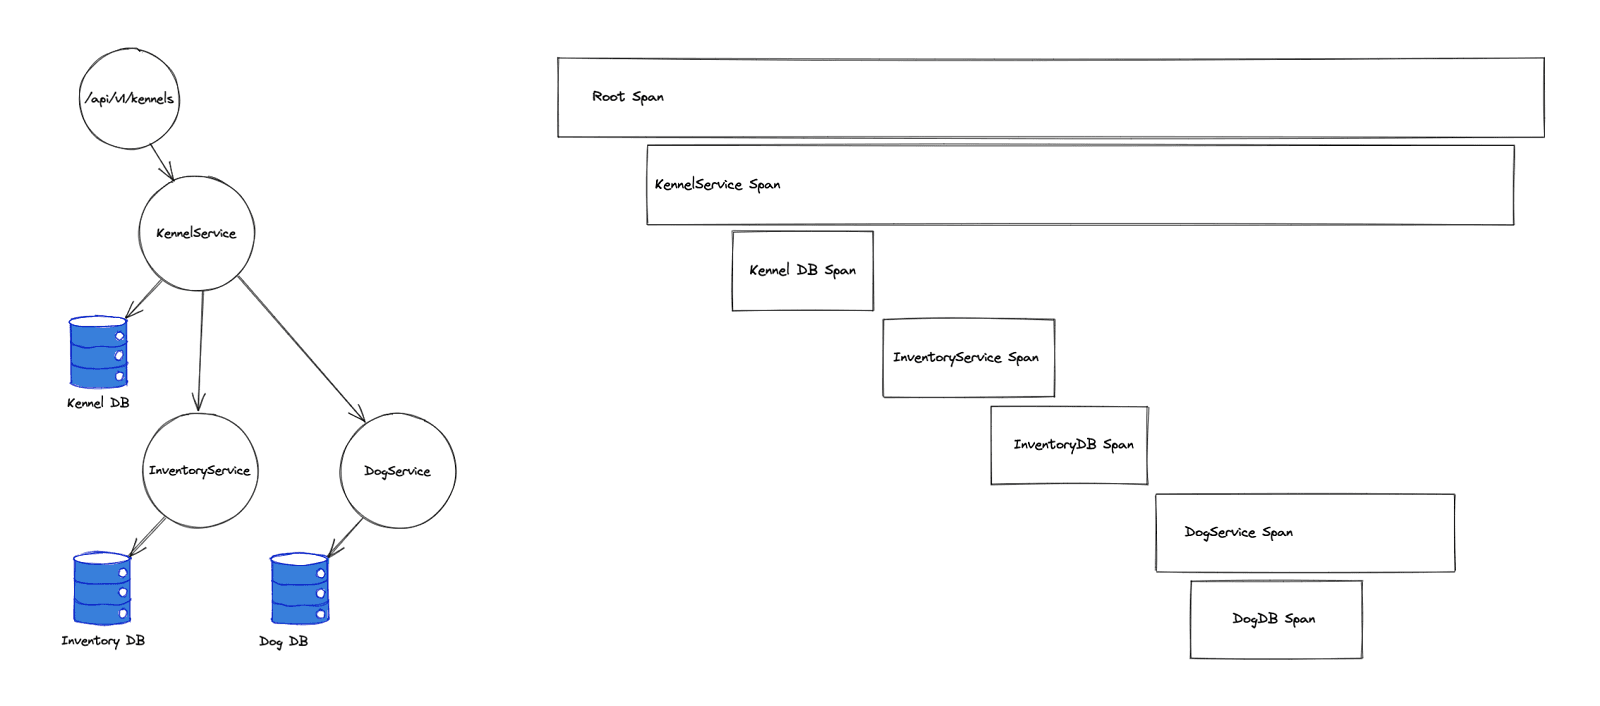
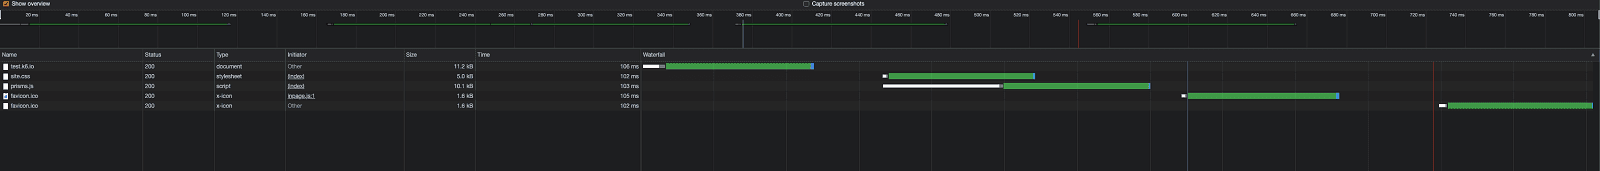
Maybe the diagram on the right looks a bit familiar? You’ve probably seen something similar before. While not exactly the same, most modern web browsers do something similar and use it in a similar manner, only the data presented is gathered in a somewhat different way.
In addition to being nestable, each span also holds instrumentation data and timings, which is what makes distributed tracing so powerful.
A single span typically captures the following data:
- An operation name.
- Start and finish timestamps.
- Tags, which basically are key-value pairs of arbitrary data.
- A set of events, each being a tuple of three, containing a timestamp, a name, and a set of attributes.
- A parent span identifier.
- Links to other causally related spans (via the
SpanContextof those related spans). - SpanContext, which is used to reference a span. These include the trace ID and span ID, among other things.
Demo
Now over to the fun stuff! To keep things simple, we’ll replace the databases with mock data. However, we’ll still place the data logic in their own functions (with their own spans), just to get some more pretty spans to look at.
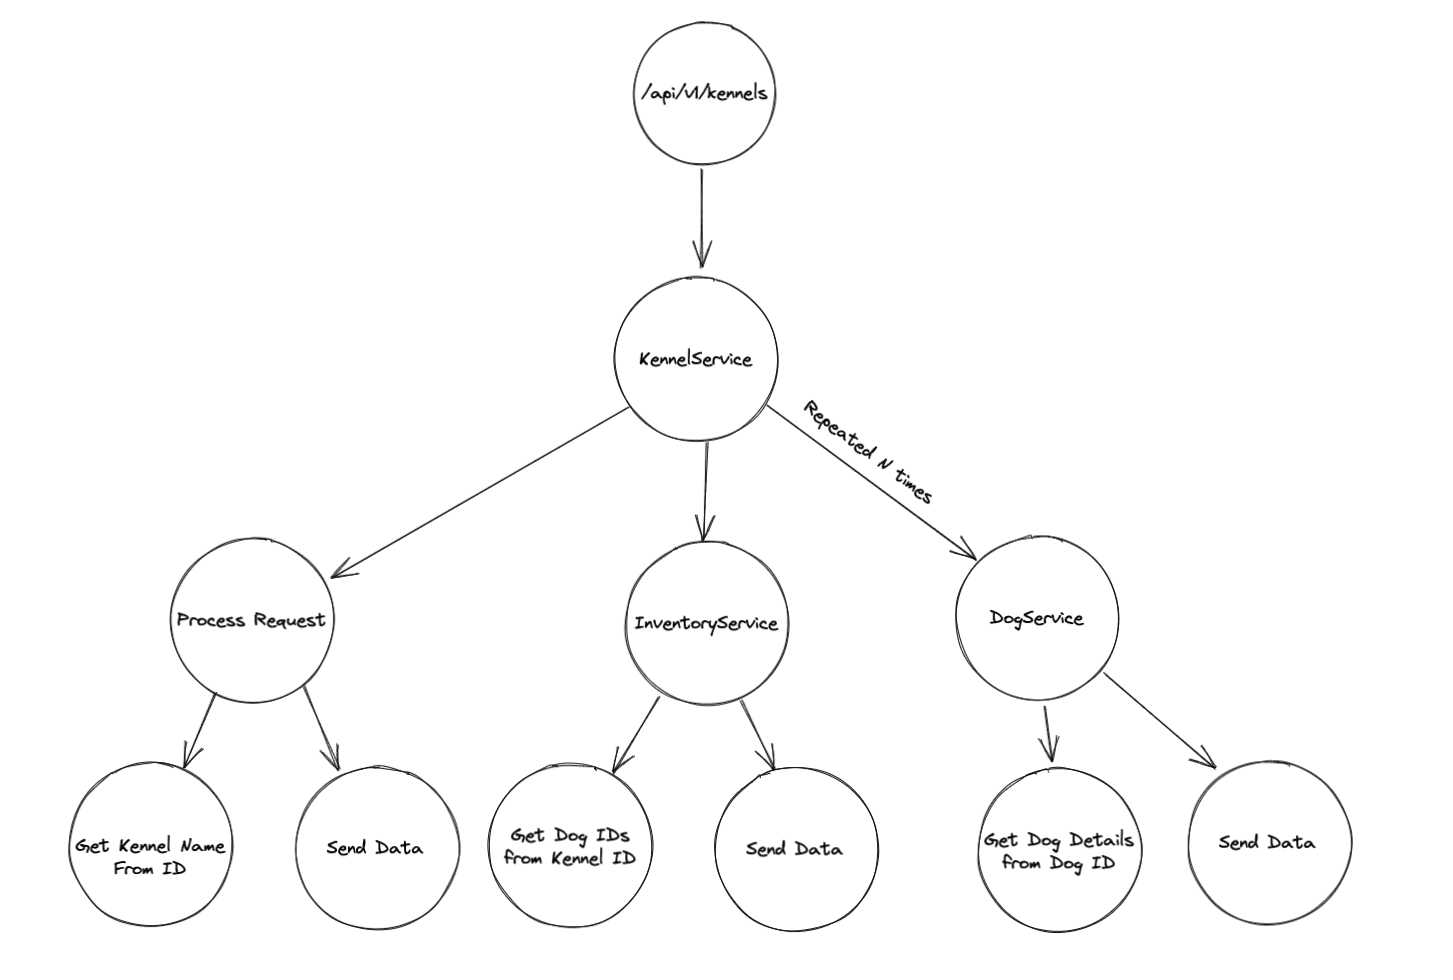
We’ll implement this in JavaScript as three different microservices, all running in their own Docker containers.
$ tree

.
├── agent.yaml
├── docker-compose.yml
├── nginx
│   └── conf.d
│       └── default.conf
├── otel-config.yaml
└── services
    ├── dogs
    │   ├── Dockerfile
    │   ├── package.json
    │   └── src
    │       ├── index.js
    │       └── tracer.js
    ├── inventory
    │   ├── Dockerfile
    │   ├── package.json
    │   └── src
    │       ├── index.js
    │       └── tracer.js
    └── kennels
        ├── Dockerfile
        ├── package.json
        └── src
            ├── data.js
            ├── index.js
            └── tracer.js
The tracer.js files and Docker files for all three services are identical. In the case of the Docker file, this is likely just temporary, which is why we keep a separate file per project.
# ./services/*/Dockerfile

FROM node:latest
WORKDIR /app
COPY ./package.json package.json
RUN npm install

COPY ./src src

EXPOSE 8080
CMD ["npm", "start"]
// ./services/*/tracer.js

const initTracer = require("jaeger-client").initTracer;

function createTracer(serviceName, collectorEndpoint) {
	const config = {
		serviceName,
		sampler: {
			type: "const",
			param: 1,
		},
		reporter: {
			logSpans: true,
			collectorEndpoint,
		},
	};
	const options = {
		logger: {
			info(msg) {
				console.log("INFO ", msg);
			},
			error(msg) {
				console.log("ERROR", msg);
			},
		},
	};

	return initTracer(config, options);
}

module.exports = {
	createTracer,
};
For the tracer.js, we could of course keep a shared file in a separate utility package, but for the sake of simplicity, I’ve just gone ahead and duplicated it to avoid complicating the build.
NGINX will be used in this setup as a reverse proxy, allowing us to consume the container APIs through a unified interface, rather than exposing them to the outside directly.
# ./nginx/conf.d/default.conf

upstream dogs {
    server dogs:3000;
}

upstream inventory {
    server inventory:8080;
}

upstream kennels {
    server kennels:8080;
}

server {
    server_name dogbook;

    location ~ ^/api/v1/dogs {
        proxy_pass http://dogs/$uri$is_args$args;
    }

    location ~ ^/api/v1/inventory {
        proxy_pass http://inventory/$uri$is_args$args;
    }

    location ~ ^/api/v1/kennels {
        proxy_pass http://kennels/$uri$is_args$args;
    }
}
While all endpoints may be consumed independently, the one we’re interested in for the sake of this demo is /api/v1/kennels, as this in turn will consume both of the other APIs as part of its logic.
// ./services/kennels/src/index.js

const express = require("express");
const opentracing = require("opentracing");
const data = require("./data");
const { createTracer } = require("./tracer");

const tracer = createTracer(
	"kennels-service",
	"http://collector:14268/api/traces"
);

const app = express();

app.use("/", async (req, res) => {
	const parent = tracer.extract(opentracing.FORMAT_HTTP_HEADERS, req.headers);
	const span = tracer.startSpan("kennels.process-request", {
		childOf: parent,
	});

	const id = req.query.id;
	const name = await data.getKennelName(id, span, tracer);

	if (!name) {
		res.status(404);
		res.send();
		span.finish();
		return;
	}

	const inventory = await data.getInventory(id, span, tracer);

	let dogs = await Promise.all(
		inventory.map(async (x) => {
			const name = await data.getDogDetails(x, span, tracer);
			return {
				id: x,
				name,
			};
		})
	);

	res.send({ name, dogs });
	span.finish();
});

app.listen("8080", "0.0.0.0");
// ./service/kennels/src/data.js

const axios = require("axios");
const opentracing = require("opentracing");

function getKennelName(id, parent, tracer) {
	const span = tracer.startSpan("kennels.get-dog-details", {
		childOf: parent,
	});
	const name = [
		"awesome kennel",
		"not as awesome kennel",
		"some other kennel",
	][id];
	span.finish();
	return name;
}

async function getDogDetails(id, parent, tracer) {
	const span = tracer.startSpan("kennels.get-dog-name", { childOf: parent });
	let name;
	try {
		let headers = {};
		tracer.inject(span, opentracing.FORMAT_HTTP_HEADERS, headers);
		const res = await axios.get(`http://dogs:8080/?id=${id}`, { headers });
		name = res.data;
	} catch (e) {
		console.log(e);
	}

	span.finish();
	return name || "Nameless Dog";
}

async function getInventory(id, parent, tracer) {
	const span = tracer.startSpan("kennels.get-inventory", { childOf: parent });
	let result;

	try {
		let headers = {};
		tracer.inject(span, opentracing.FORMAT_HTTP_HEADERS, headers);
		const response = await axios.get(
			`http://inventory:8080/?kennelId=${id}`,
			{
				headers,
			}
		);
		result = response.data;
	} catch (e) {
		console.log(e);
		result = [];
	}

	span.finish();
	return result;
}

module.exports = {
	getKennelName,
	getDogDetails,
	getInventory,
};
So let’s try to unpack what’s going on here. We’re using Express to create a simple HTTP API. It currently consists of one single endpoint: the root. We then check the request for tracing headers to see whether it’s part of an existing trace, and create a new span, including the span ID of the parent if any is present.
We then execute the actual “business logic,” resolving the kennel name from the ID, and fetch that kennel’s inventory and loop through it, fetching the name of each dog present one by one.
Worth noting is that in each call to the subsequent services from data.js, we inject tracing headers to make sure the trace stays coherent even as we traverse multiple separate services, all running in their own processes.
// ./services/inventory/index.js

const express = require("express");
const axios = require("axios");
const opentracing = require("opentracing");

const { createTracer } = require("./tracer.js");

const tracer = createTracer(
	"inventory-service",
	"http://collector:14268/api/traces"
);

const app = express();

app.use("/", async (req, res) => {
	const parent = tracer.extract(opentracing.FORMAT_HTTP_HEADERS, req.headers);
	const span = tracer.startSpan("inventory.process", { childOf: parent });
	const id = req.query.kennelId;
	span.setTag("inventory.kennel-id", id);

	const ids = await getInventoryByKennelId(id, span);
	res.send(ids);
	span.finish();
});

app.listen("8080", "0.0.0.0");

async function getInventoryByKennelId(id, parent) {
	const inventory = [[0], [1, 2], [3, 4, 5]];

	const span = tracer.startSpan("inventory.get-inventory-by-kennel-id", {
		childOf: parent,
	});

	await new Promise((resolve) => setTimeout(resolve, 100));
	span.finish();
	return inventory[id];
}
And the inventory and dogs services basically replicate the same behavior. To make the trace a little more interesting, we’ll also add a sleep to the inventory service using a Promise and setTimeout.
// ./services/dogs/index.js

const express = require("express");
const axios = require("axios");
const opentracing = require("opentracing");

const { createTracer } = require("./tracer.js");

const tracer = createTracer(
	"dogs-service",
	"http://collector:14268/api/traces"
);

const app = express();

app.use("/", async (req, res) => {
	const parent = tracer.extract(opentracing.FORMAT_HTTP_HEADERS, req.headers);
	const span = tracer.startSpan("dogs.process-request", { childOf: parent });
	const id = req.query.id;
	span.setTag("dogs.id", id);

	const name = await getDogName(id, span);
	res.send(name);
	span.finish();
});

app.listen("8080", "0.0.0.0");

async function getDogName(id, parent) {
	const names = ["Rufus", "Rex", "Dobby", "Möhre", "Jack", "Charlie"];

	const span = tracer.startSpan("inventory.get-dog-name", {
		childOf: parent,
	});
	await new Promise((resolve) => setTimeout(resolve, 100));
	span.finish();
	return names[id];
}
Now let’s try this out. Before we’ll be able to do that, though, we also need to create a compose file with the configuration needed to launch all of the containers.
version: '3.1'

services:
  nginx:
    image: nginx:latest
    ports:
      - '80:80'
      - '443:443'
    volumes:
      - ./nginx/conf.d:/etc/nginx/conf.d
    depends_on:
      - kennels
  collector:
    image: otel/opentelemetry-collector:0.23.0
    command: '--config /etc/otel-config.yaml'
    volumes:
      - ./otel-config.yaml:/etc/otel-config.yaml
    ports:
      - 6831:6831
  dogs:
    build: ./services/dogs
  inventory:
    build: ./services/inventory
  kennels:
    build: ./services/kennels
We won’t add any port mappings for the JavaScript services, as we won’t access them directly but rather through the NGINX reverse proxy. We’ll also set up an opentelemetry-collector, which we’ll use to collect our tracing data and forward it to our tracing backend.
receivers:
 jaeger:
   protocols:
     thrift_compact:
     thrift_http:

processors:
 batch:

exporters:
 logging:
    loglevel: debug
 otlp:
   endpoint: tempo-us-central1.grafana.net:443
   headers:
     authorization: Basic <Base64 version of your username:api-key>

service:
 pipelines:
   traces:
     receivers: [jaeger]
     processors: [batch]
     exporters: [otlp]
You may, of course, use whichever tracing backend (and UI) you want, but in this article, we’ll be using a managed version of the open source project Tempo together with Grafana Cloud. This will allow us to quickly and easily visualize, analyze, and explore our traces.
With all the configuration done, we’ll deploy our stack.
$ docker-compose up -d
We’ll then do a request and check the logs for a trace id:
$ curl localhost "localhost/api/v1/kennels?id=2" && docker logs distributed-tracing-demo_kennels_1

[...]

INFO  Reporting span c3d3fa296e838a66:c3d3fa296e838a66:0:1
Let’s copy the first part of the span ID, c3d3fa296e838a66, which is the trace ID, and search for it in Grafana.
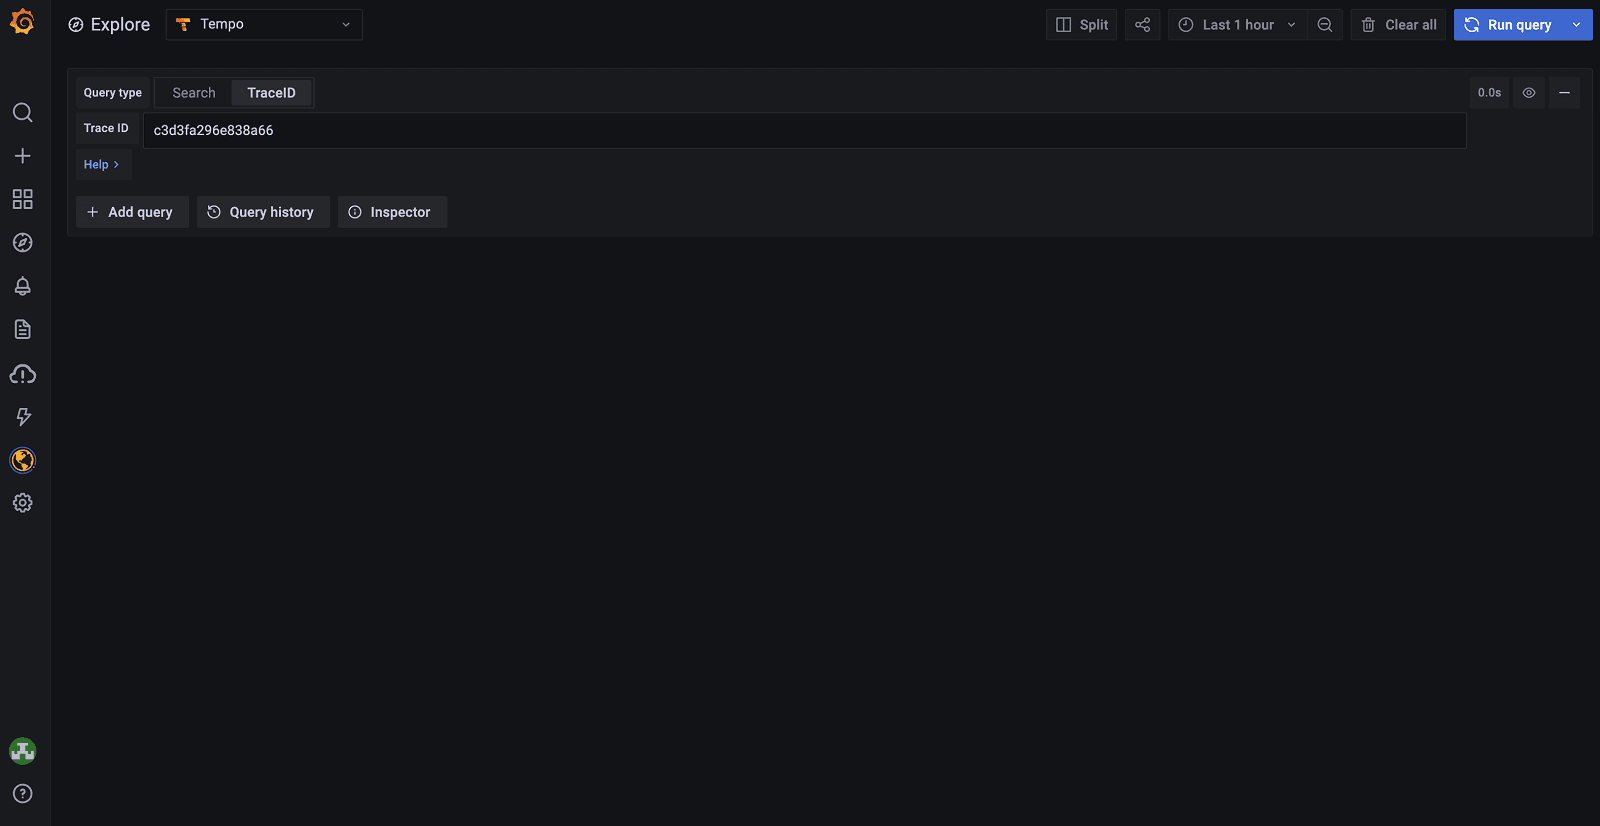
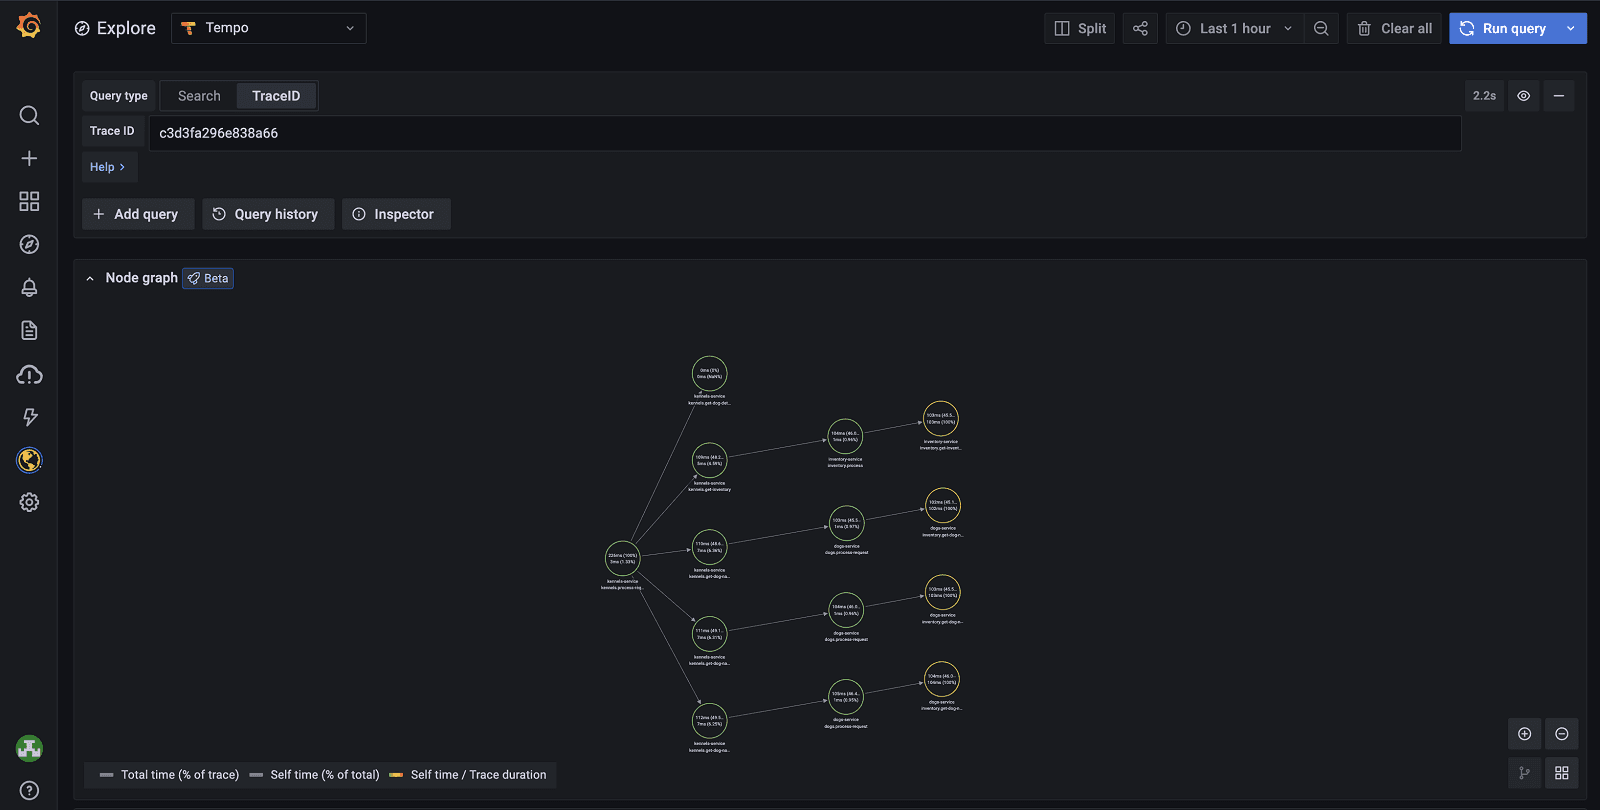
All right, this is actually quite cool already! We’re able to see the causal relationship model we talked about earlier and what percentage of the execution time is used in each span.
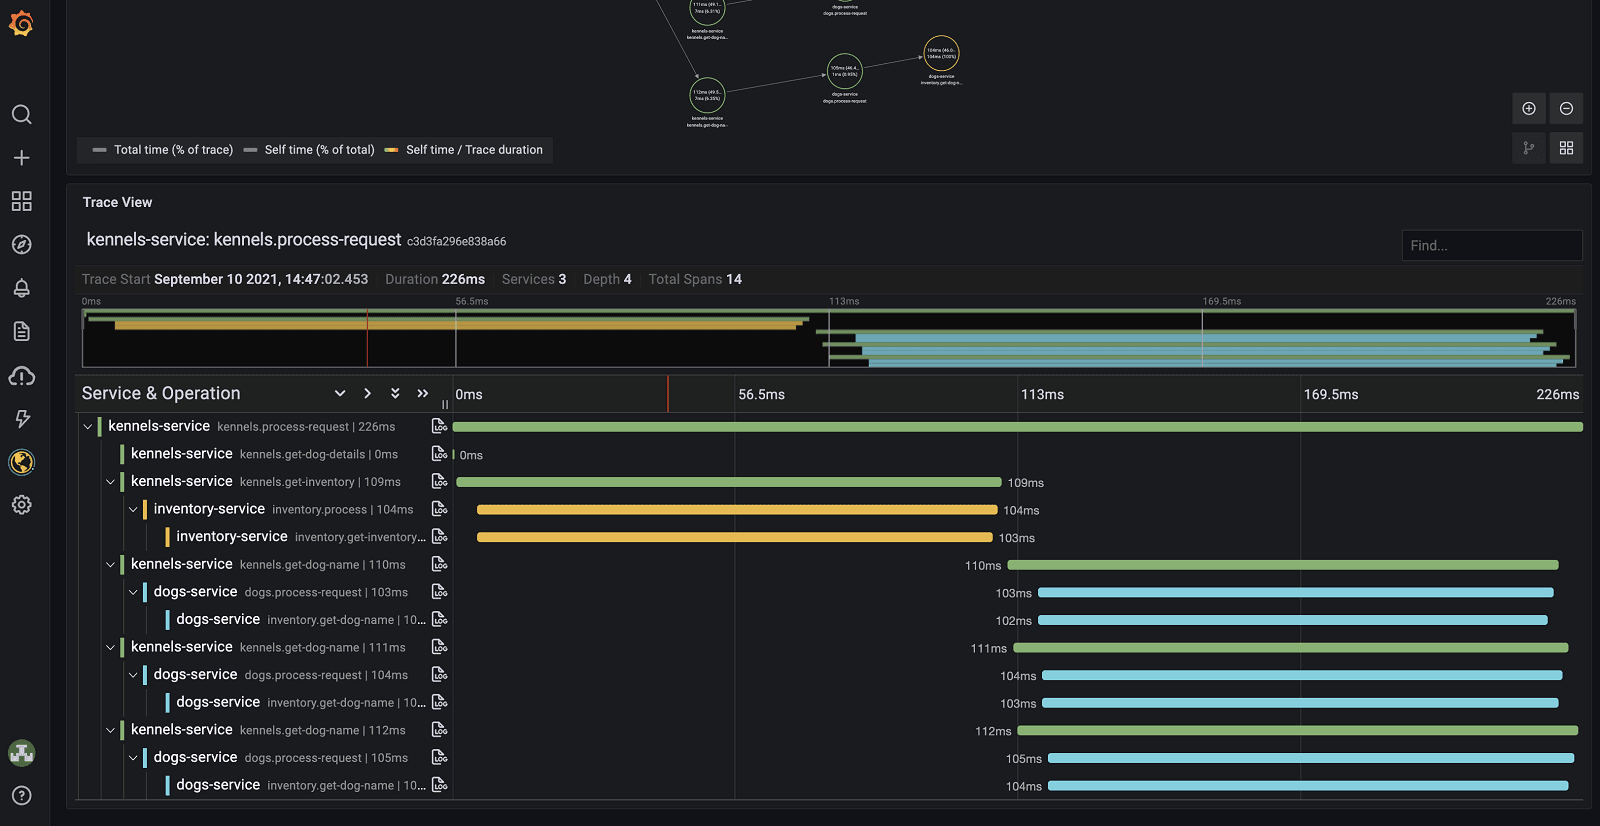
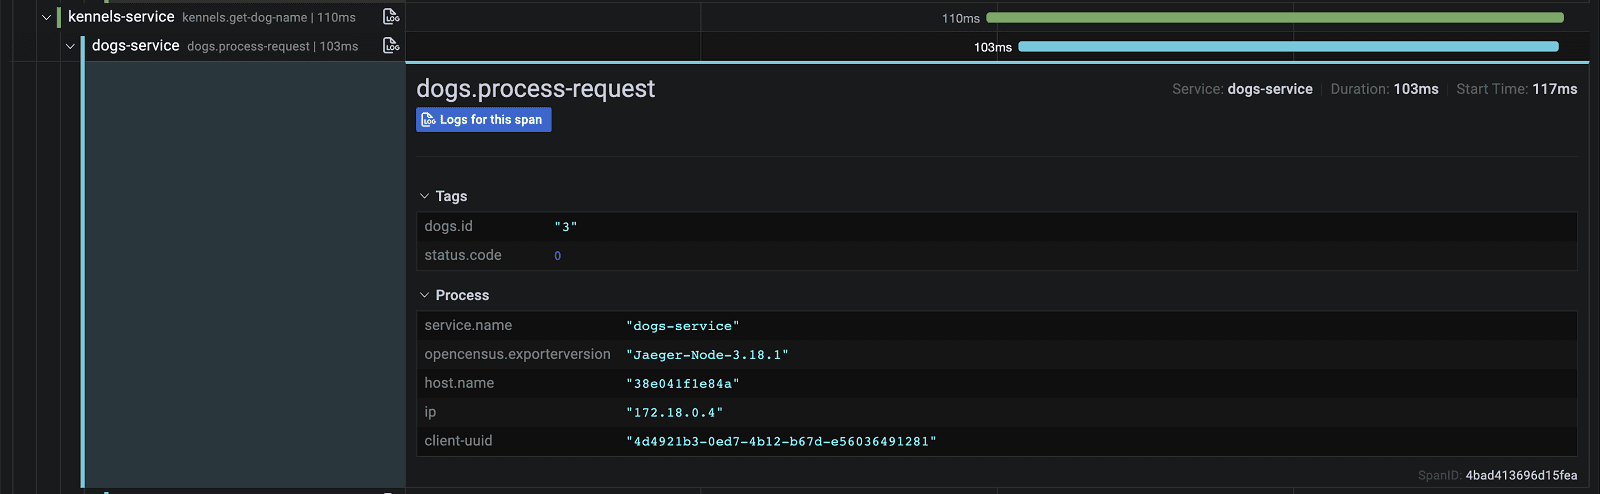
If we scroll a bit further down the page, we get the waterfall view of the same trace, with the ability to drill down further into the details and inspect things like tags, logs, etc.
🤯
How to implement
How do we actually implement this in our existing projects then? I totally get that there might be multiple reasons as to why it would be impractical, to say the least, to implement distributed tracing in your current project. Besides requiring developers to actively instrument the services, it takes quite a bit of effort to get right.
Do not despair! Getting it right might very well be out of reach right now, but getting somewhere is nowhere near as time consuming. For many popular languages, like JavaScript, Go, Python, and Java, automatic instrumentation of many standard packages is already available!
So instead of doing nothing, start by giving them a try! Maybe they’re just what you need to hunt down that nasty performance issue that’s been haunting you for months? Just getting the timings for each service will be a great help in pinning down inefficient code!
You’ll quickly build a repertoire of examples where tracing has saved your bacon, and with those available, you’ll have a much stronger case for getting the organizational buy-in you need to keep iterating, building out the instrumentation, and slowly working your way towards “getting it right”!
The easiest way to get started with Tempo and tracing is Grafana Cloud. We have free and paid plans for every use case. Sign up for a free account now!

