

The year in AI at Grafana Labs
2025 was the year we at Grafana Labs went all-in on AI—and boy, what a year it was. Not only did we establish and start to execute our overarching strategy (build actually useful AI), we also took one of our most exciting new features (Grafana Assistant) from idea to general availability in just nine months!
Yes, there's no shortage of articles singing the praises of AI these days, but let's dispense with the hyperbole and focus on some actually useful content. After all, there's plenty to dig into if you want to learn how we're building tools to make your observability practices faster, easier, and more effective.
A hackathon high point hits the big time
We're big believers in hackathons at Grafana Labs. We run several a year, and many of the winning ideas (and even plenty of non-winners) have found their way into Grafana Cloud and our various open source projects.
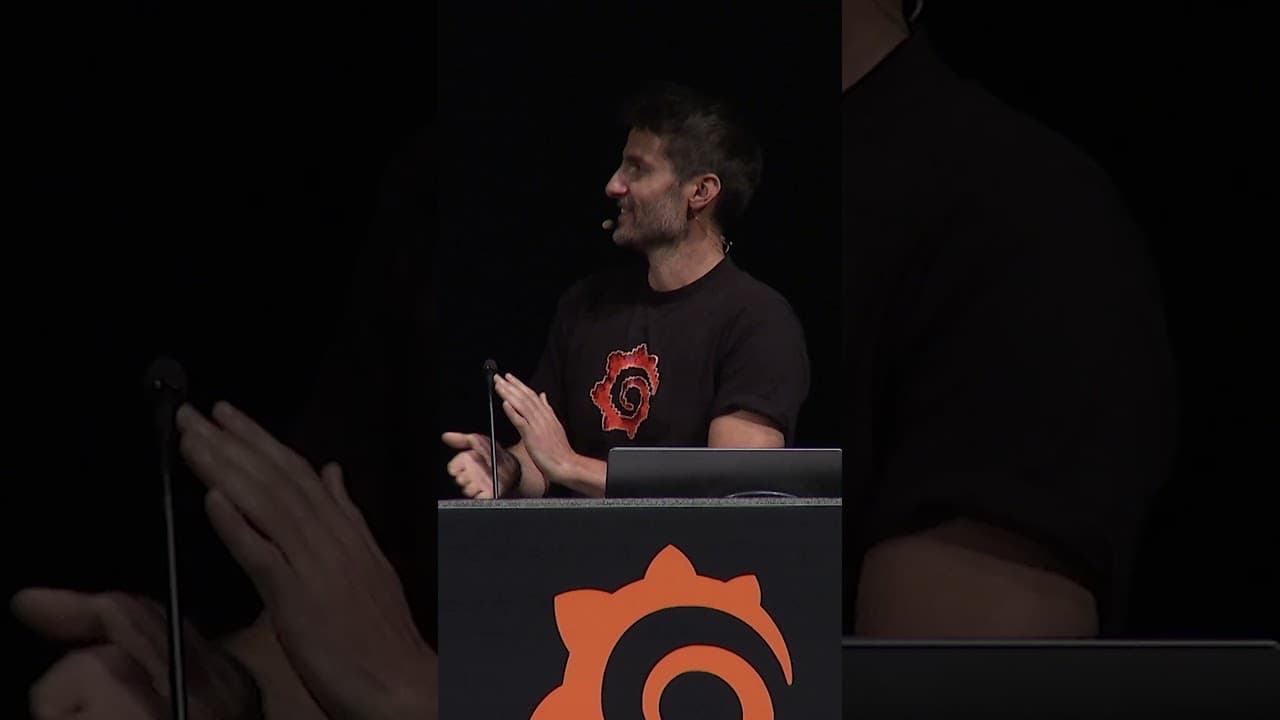
But none of these initiatives has taken off quite the way Grafana Assistant has. The AI agent, which is embedded directly into Grafana, won our 12th hackathon back in March, and by May it was being featured on stage at GrafanaCON 2025. It even drew some of the biggest applause during a jam-packed keynote. (And keep in mind: This is when we started to invest heavily into AI, so we’re actually doing a 9 month review when it comes to Assistant!)
But perhaps that shouldn't come as a surprise. When Grafanistas Mat Ryer and Cyril Tovena got to the end of their live demo, they asked Grafana Assistant to build a dashboard from scratch, and it just did it. Magic, right? Well, no, of course not—there was a lot of work that went into getting that far that fast, but more on that later.
However, in that moment, it did feel sort of, well, magical. Grafana's flexibility makes the visualization platform incredibly powerful, but it can also overwhelm newcomers. And yet, there was Assistant, trained on vast amounts of data about Grafana, doing all the dirty work. What could have taken minutes or even hours to do manually was done in seconds—all based on plain language prompts.
This is the type of leap that can break down barriers for beginners (Swifties unite!) and claw back valuable time for experts (yes, even our own). And dashboarding was just one of the capabilities highlighted that day. Assistant could also help you:
- Investigate issues and anomalies
- Understand telemetry trends and patterns
- Navigate Grafana more intuitively
And this was just the beginning.
Finding our place in the AI landscape and coming out a leader
Going from hackathon hopeful to keynote showstopper in just two months may seem like a dizzying pace—and, in fairness, it was—but that only happens if you have a set of guiding principles to light the way.
We're far from the first observability company to jump into AI—and that was intentional. We didn't want to devote resources to a project just for the sake of checking a box. We wanted to wait until we could build something that actually helped our users, and 2025 was the year we saw the pay off from that approach.
In August, as Assistant went into public preview, we published a blog post outlining our perspective on building AI solutions. We talked about how we focus on solving specific problems and gearing our products toward delivering specific outcomes. As we outlined in the last section, Assistant was built to do just that. Moreover, we intentionally developed it as a panel directly in the Grafana Cloud UI so you don't have to worry about context switching and can instead focus on completing the task at hand.
We also addressed how a decade-plus of building open source projects played a critical role in the rapid development of Assistant. Our work, processes, and contributions are on full display across the internet. LLMs are famously hungry for needing lots of data to train on, and we were pleasantly surprised to see how years of sharing in the open was almost a super power. We didn't need to feed mountains of data into these LLMs so they could understand us—they already knew!
AI in Grafana OSS
Though Assistant is only available in Grafana Cloud, we continue to invest in AI capabilities for our OSS users. More specifically, we've built an LLM app plugin. This open source plugin securely connects to providers like OpenAI to generate queries, explore dashboards, and interact with Grafana. It also includes an MCP server so you can grant your favorite AI application access to your Grafana instance.
Finally, we talked about the importance of keeping humans in the loop. AI doesn't supplant you, it supports you, taking on tedious, time-consuming tasks so you can focus on higher-priority tasks that require your expertise. Plus, as we all know by now, AI is not perfect. You still need to be involved to make sure it's producing the right outcomes.
Taken collectively, we think this approach has set us apart and helped put us at the forefront of the market in short order. We're developing AI capabilities you actually want to use, rather than ones you have to use, and we'll continue to lean on these principles to guide our efforts going forward.
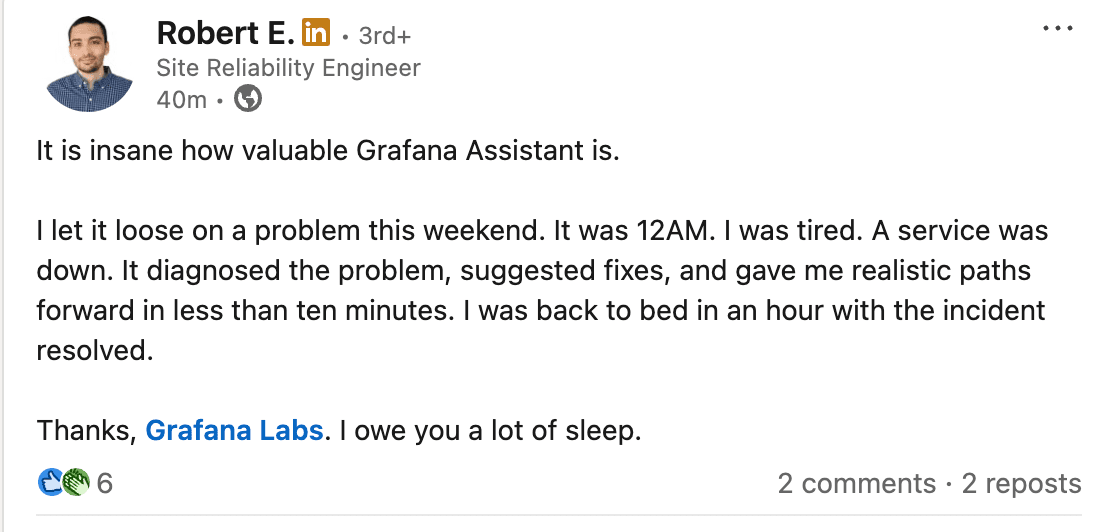
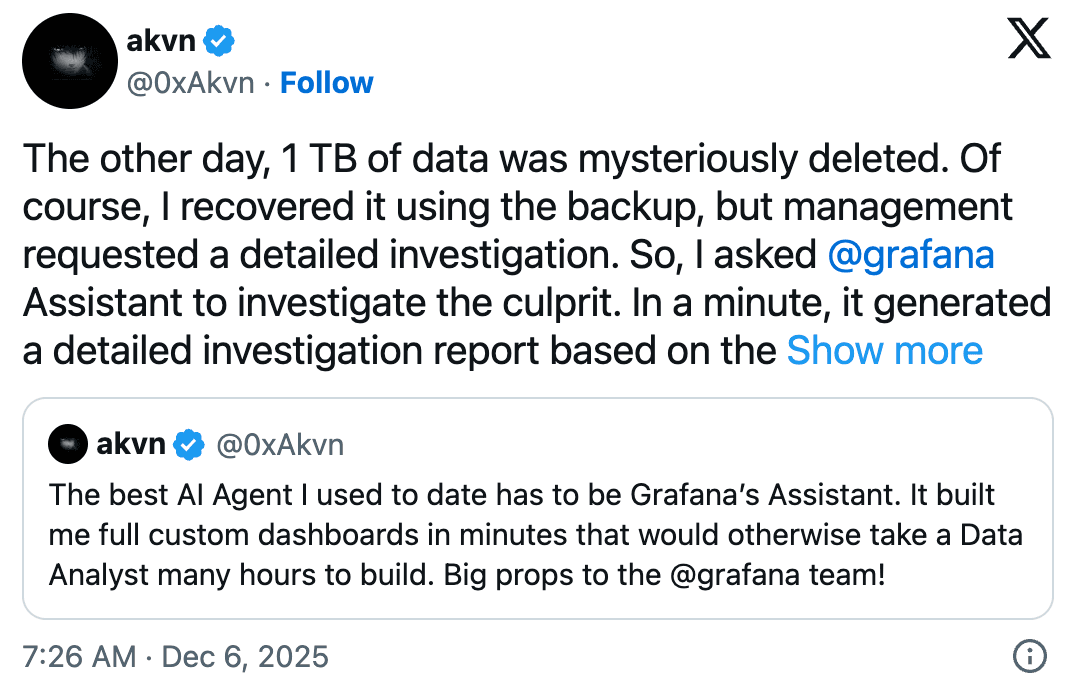
But don't just take our word for it. Just look at all the positive feedback we've been getting so far:
Carousel with 4 slides. Use previous and next buttons to navigate.


Expanding the reach of Grafana Assistant
Since that initial launch of Assistant, we've been busy improving and expanding the ways it can help you. One of the most exciting examples of this is Assistant Investigations. First announced at ObservabilityCON 2025 to coincide with the general availability of Assistant, it's built to accelerate multi-step incident investigations in Grafana Cloud.
Currently in public preview, Assistant Investigations coordinates a swarm of specialized AI agents to analyze your observability stack, diving into your metrics, logs, traces, and profiles to find anomalies and build up a picture of your system. It collects evidence in parallel, generating findings and hypotheses so it can provide actionable recommendations for mitigation and remediation. And since it’s embedded directly into Grafana Assistant, our AI chatbot designed specifically for Grafana, you get a seamless, guided workflow for resolving complex incidents.
We're seeing great results from Assistant Investigations so far. In fact, it recently managed to find and resolve an internal incident 3.5 times faster than our own on-call engineers!
Connecting the dots across Grafana Cloud
As part of our efforts to make Assistant even more powerful, we've been hard at work integrating it with other Grafana Cloud features to simplify your efforts to configure your environment and monitor your various resources.
In recent months we've added support for these services:
- Fleet Management: Fleet Management is our go-to feature for managing collectors at scale, and now you can use natural language to ask about your pipelines, read configurations, create new ones, or update existing ones.
- Grafana Alloy: Assistant can help you create and update configurations in our distribution of the OpenTelemetry Collector. By combining this with the Fleet Management integration, troubleshooting configuration becomes easier than ever.
- Kubernetes Monitoring: This is one of our most popular solutions because of how powerful it is in monitoring your Kubernetes resources, but that power can also lead to complexity challenges. Now, you can ask the assistant to distill the information in any given panel in plain language. You can also use it to investigate any Kubernetes object to help accelerate your incident response.
- Knowledge Graph: The knowledge graph uses auto-discovery to create a dynamic network representing your infrastructure and application components so you know why something is breaking. Assistant can use that data as context specific to your environment, turning complex root-cause analysis into a guided conversation for faster resolution.
- Alerting: Alerting functionalities arrived in Grafana Assistant in web and in Slack. Ask about firing alerts, alert rules, contact points, notification policies and more on your desktop and on your phone whenever and wherever. This allows you to start troubleshooting and finding root causes faster than ever.
- Bring any remote MCP server: Grafana Assistant is built on our open foundations. You can bring any remote MCP server of any tool into Grafana Assistant and Assistant Investigations to enrich your observability setup. You can also have the Assistant take actions for you somewhere else, for example in GitHub. If you find problems in your services, you can easily raise an issue for that using the GitHub MCP server.
- Grafana Assistant in Slack: Grafana expertise is now available outside of Grafana! Chat with Grafana Assistant directly in Slack and collaborate in real-time with your colleagues on issues.
In addition to all these integrations, we've also added support for Cursor Cloud Agents to bring together telemetry signals and coding. You can have Grafana Assistant or Assistant Investigations analyze an issue for you and have it start a Cloud Agent to raise a pull request to fix it.
Observing all the LLMs
While we've been hard at work bolstering our assistant, we've also developed tools designed specifically for monitoring other LLMs. AI Observability, a solution in Grafana Cloud, leverages OpenLIT, the open source SDK that has been engineered to monitor, diagnose, and optimize generative AI systems.
You can use this solution to observe every nuance of your AI models, from performance bottlenecks to anomaly detection, all within the unified Grafana interface. Check out our recent blog on monitoring Amazon Bedrock AgentCore to see how you can put it to use today.

We also introduced the Anthropic integration for Grafana Cloud, a new solution that lets you connect directly to the Anthropic Usage and Cost API from within Grafana Cloud.
2026 here we come
2025 really was a big year for AI at Grafana Labs. We've been overwhelmed by how quickly Assistant has been embraced—we've seen 10x growth in our user base in 90 days alone— but we have even bigger plans for the year ahead.
The Grafana Assistant ecosystem will surely grow, so if you want to be the first to hear about our work, make sure to register for GrafanaCON 2026 in Barcelona. Stay tuned for plenty more, and start trying out the AI features we've discussed here so you can start improving your observability practices today!
And for more information on Grafana Cloud AI, including FAQs about Assistant and our other AI capabilities, check out our AI observability page.
Grafana Cloud is the easiest way to get started with metrics, logs, traces, dashboards, and more. We have a generous forever-free tier and plans for every use case. Sign up for free now!

