ServiceNow and Grafana: How to receive Grafana alert payloads via ServiceNow’s scripted REST API
When you integrate Grafana-managed alert rules with ServiceNow, you can automatically capture and process alerts in ServiceNow’s events table—a common entry point for incident workflows, escalations, and ticket creation.
And if you configure ServiceNow to receive Grafana Alerting payloads using ServiceNow’s scripted REST API, you can parse Grafana’s JSON alert payloads and insert them into a ServiceNow table. This approach helps you bridge the gap between Grafana's flexible alert payloads and ServiceNow's structured data tables. It ensures all your alert details are preserved, and lets you trigger downstream automation in ServiceNow's powerful incident management ecosystem.
So if you're a platform engineer, SRE, or solutions engineer who need to ingest Grafana-managed alert payloads directly into ServiceNow, this practical, step-by-step guide can help your team parse complex alert JSON files, map fields into ServiceNow tables, and automate incident workflows using a scripted REST API.
Why use ServiceNow’s scripted REST API?
Grafana Alerting payloads often contain nested arrays and multiple instances in a single request. ServiceNow’s default REST endpoints may attempt to map only high-level fields, skipping deeper nested values. The benefits of using a scripted REST API:
- Lets you disassemble complex payloads.
- Maps custom labels from Grafana into the correct ServiceNow table fields.
- Creates one record per alert instance within a multi-instance payload.
- Avoids the limitations of ServiceNow’s default payload parsing.
Flow description
At a high-level, here is workflow you'll establish by following this guide:
- Grafana alert triggered: A managed alert evaluates and fires.
- Webhook POST: An alert payload is sent to ServiceNow Scripted REST API endpoint.
- Service Now Scripted REST API processing: A script extracts labels, timestamps, and other details from the payload.
- Record creation: The script inserts one record per alert instance into the target ServiceNow table (often
em_eventor a custom table likeu_testgrafanasheet). - Automation: ServiceNow workflows, incident creation, or escalations can be triggered automatically.
Note: The steps outlined below will work for Grafana OSS or Grafana Cloud.
Step 1: Prepare the ServiceNow table
1. Log in to ServiceNow.
2. Navigate to Tables via the global search.

3. Create a new table or import an existing one:
- Use Load Data if you have a sample dataset (e.g., Excel from the customer).
- For this demo, we use a table named
u_testgrafanasheet.- As a note, you can name the table anything you want. ServiceNow will automatically append the
uin front of the table name.
4. Adjust max length for columns if Grafana labels are long—otherwise, data may get truncated.
Tip: Note the internal table name (e.g., u_testgrafanasheet), as you’ll reference it in the script.
Step 2: Create the scripted REST API
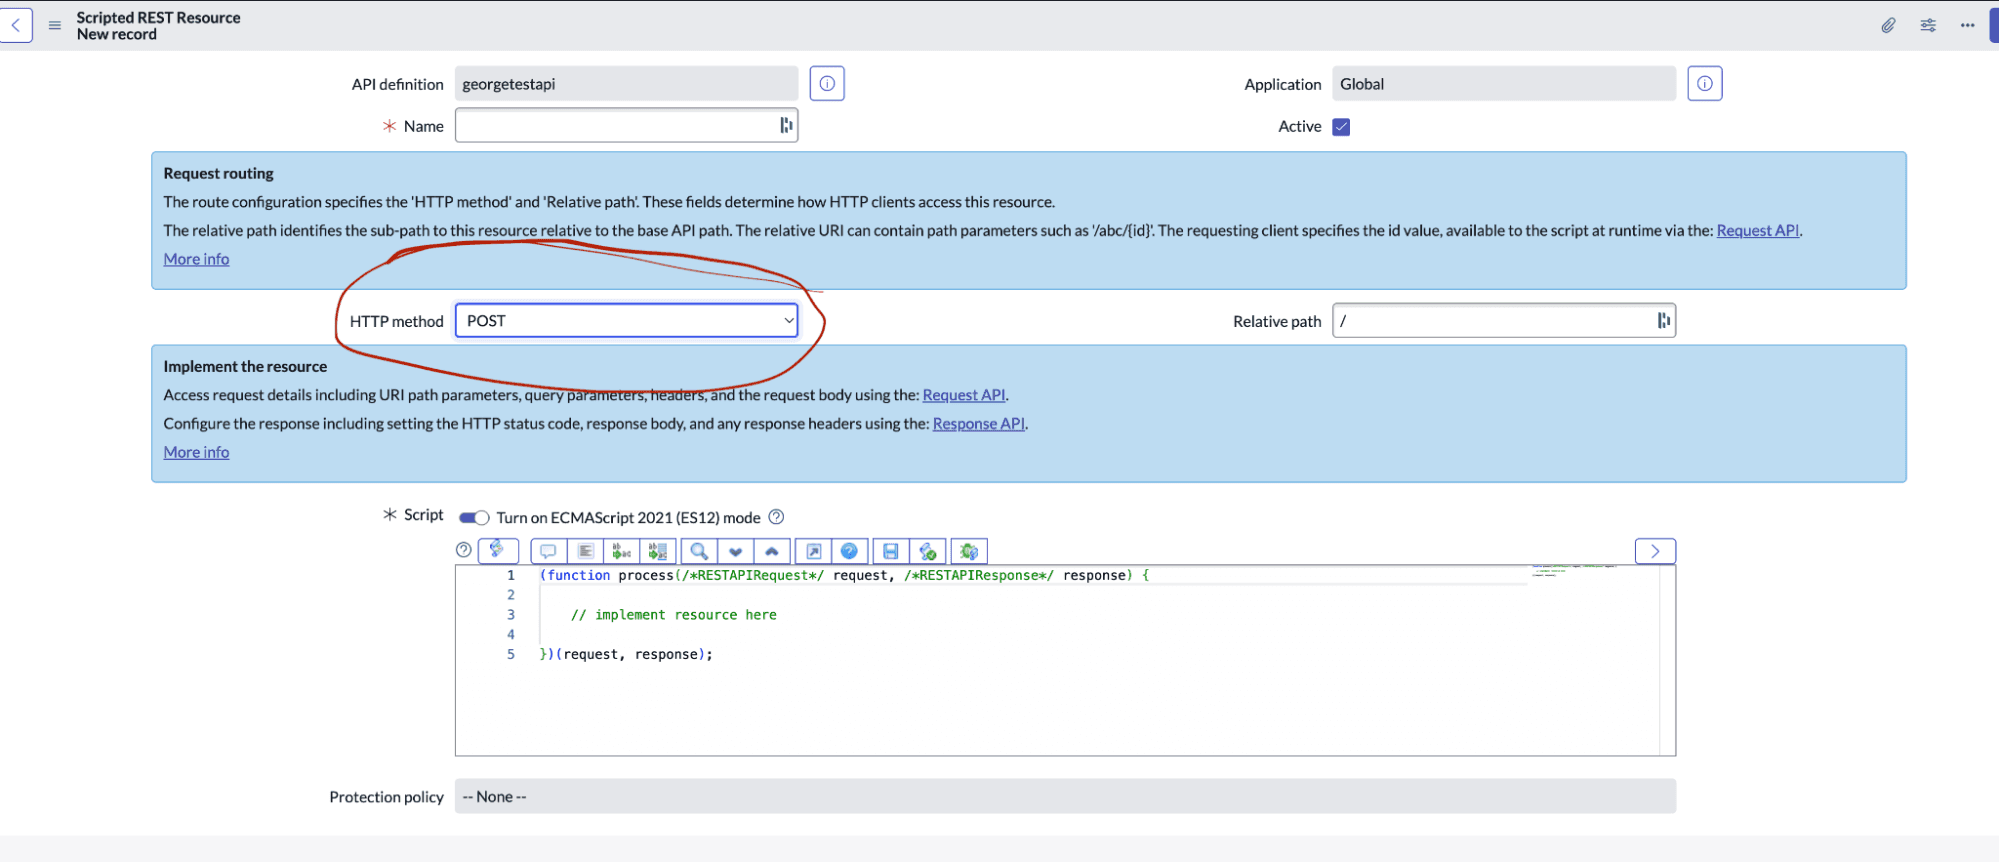
1. In ServiceNow, go to Scripted REST APIs.

2. Click New and give it a name, (e.g., "ServiceNow Grafana Connection").

3. Note the “Base API Path”—this will be used in the Grafana webhook URL.
4. Add a Resource:
- “HTTP Method”: POST
- “Name”: alert

5. In the “Script” section:
- Use GlideRecord to open the target table.
- Map payload fields from Grafana into ServiceNow columns.
- Iterate through nested alert instances to create multiple records if needed.
Example snippet:
var gr = new GlideRecord('u_testgrafanasheet');
gr.initialize();

gr.u_metric_name = requestBody.alert.labels.metric_name;
gr.u_severity = requestBody.alert.labels.severity;
gr.u_event_time = requestBody.alert.startsAt;

gr.insert();
Step 3: Configure the Grafana contact point
- In Grafana, go to Alerting → Contact points.
- Create a new contact point using Webhook.
- Set the URL to the Scripted REST API resource path from ServiceNow.
- Use POST as the HTTP method.
- Add authentication if your API is secured.
- Attach this contact point to the desired alerts.
Step 4: Test and debug
- Send a test alert from Grafana to verify the script works.
- In ServiceNow:
- Check System Logs → All to view incoming payloads.
- Confirm the alert data appears in the target table.
- Adjust mappings in your script as needed.
Other considerations:
- Error handling: Return appropriate HTTP codes for debugging and retries.
- Table selection: You can post to any ServiceNow table you have permissions for, not just the events table.
- Payload structure: Grafana’s default payload is nested—without scripting, ServiceNow won’t parse multiple instances properly.
- Security: Use service accounts and authentication for production environments.

Conclusions
As you've seen, the process of integrating Grafana Alerts with ServiceNow’s scripted API is straightforward. By leveraging a Scripted REST API, you can bridge the gap between Grafana’s flexible alert payloads and ServiceNow’s structured data tables. This integration not only ensures all alert details are preserved but also allows organizations to trigger downstream automation in ServiceNow’s powerful incident management ecosystem.
Grafana Cloud is the easiest way to get started with metrics, logs, traces, dashboards, and more. We have a generous forever-free tier and plans for every use case. Sign up for free now!


