

How to visualize your 3CX contact center phone system with Grafana
Note: this post was co-authored by Nicholas Borg, 3CX Product Manager.
3CX provides a robust, flexible IP PBX platform used by organizations of all sizes to power their contact centers. It offers detailed call activity, agent performance metrics, and operational insights — all of which become even more powerful when visualized.
To that end, we are delighted to introduce the 3CX app plugin for Grafana, which makes it easier than ever for you to visualize and explore the operational data that powers your 3CX contact center phone system directly within Grafana.
Key features of the 3CX app plugin for Grafana
With the 3CX app plugin for Grafana, you can ingest, explore, and understand your PBX data programmatically or visually, depending on your workflow.
Once connected, the plugin automatically includes a set of dashboards tailored to 3CX. These dashboards help you monitor:
- Call activity and traffic patterns
- Agent availability and performance
- Inbound vs. outbound call metrics
- Call statuses and durations
- Quality and engagement analytics

Visualizing these metrics in Grafana gives you a deeper understanding of how your phone system behaves in real time. Patterns that might be difficult to spot in raw call logs — such as surges in inbound volume, extended wait times, agent workload imbalances, or recurring call failures — become immediately visible.
This makes it easier to identify bottlenecks, optimize staffing, tune call routing, and improve the overall reliability and effectiveness of your communications strategy.
How does the 3CX plugin for Grafana work?
The 3CX app plugin is designed to work seamlessly with 3CX Data Connectors, which export PBX data to any supported database. These currently include Google BigQuery, Amazon RDS PostgreSQL, Standalone PostgreSQL, MySQL, and Microsoft SQL Server. 3CX provides detailed guides for configuring them, making it easy to adapt to your infrastructure requirements.
Grafana then reads from that database and renders a comprehensive set of dashboards, created specifically for 3CX deployments.
This architecture gives you flexibility in terms of performance, cost, and storage strategy, allowing you to choose the database storage that best meets your requirements.
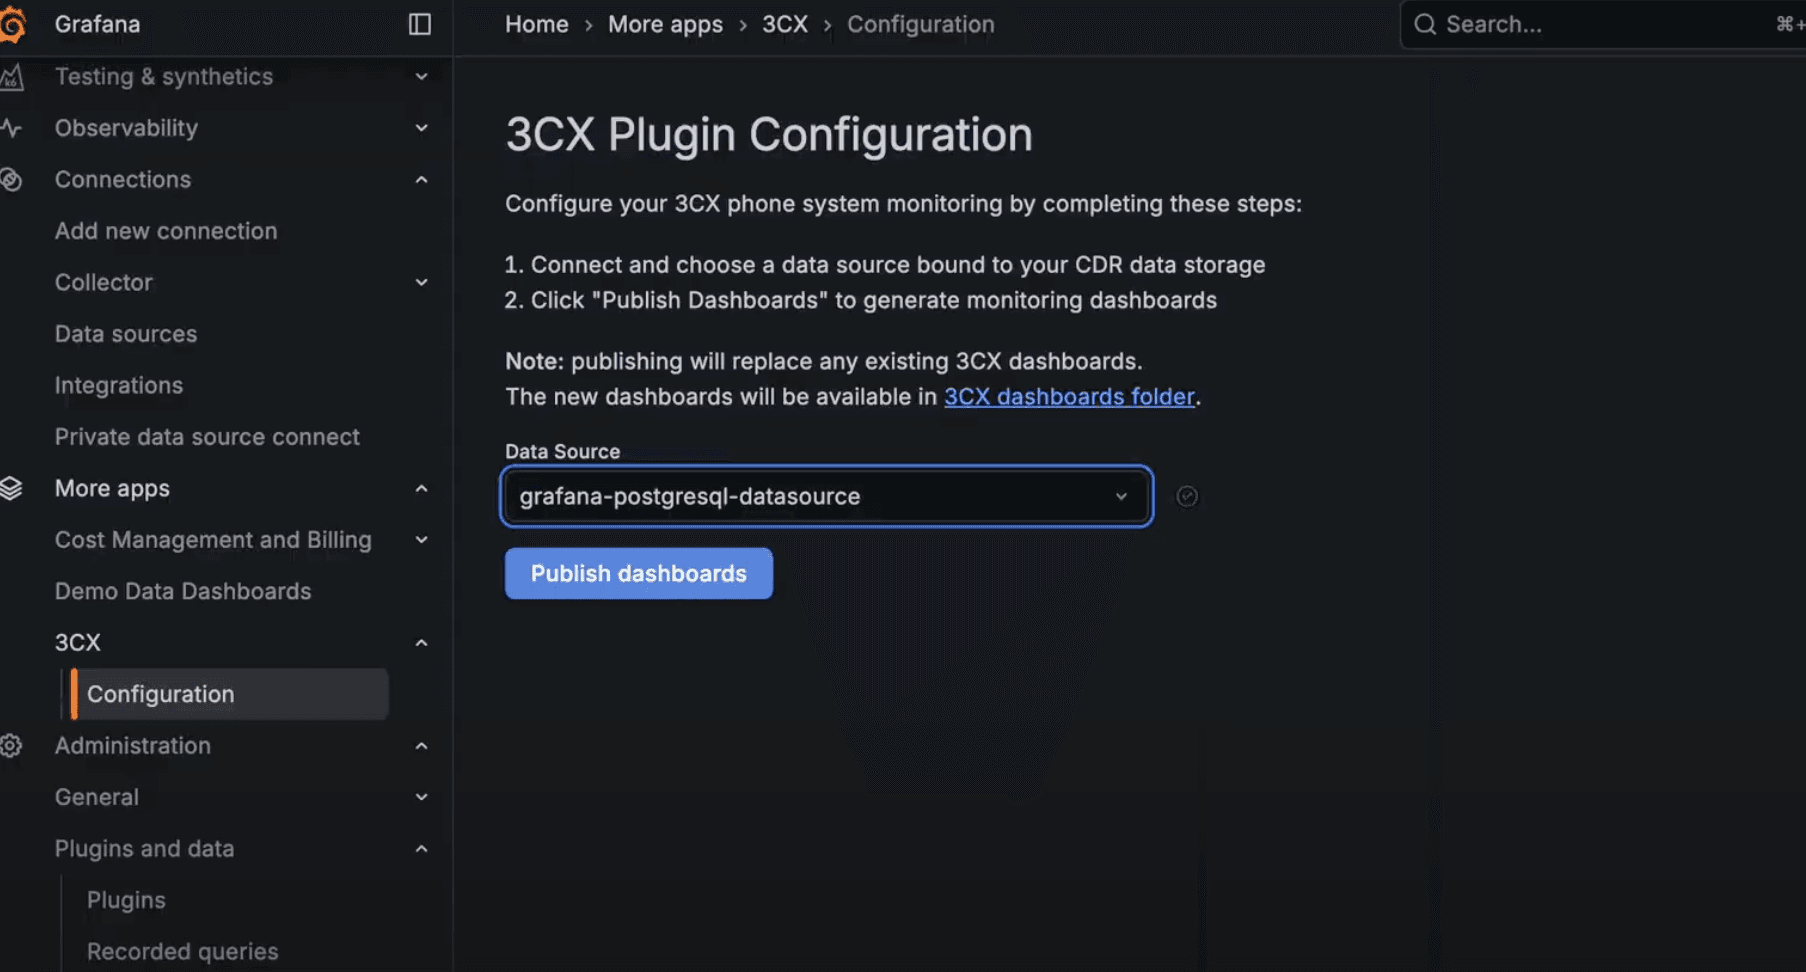
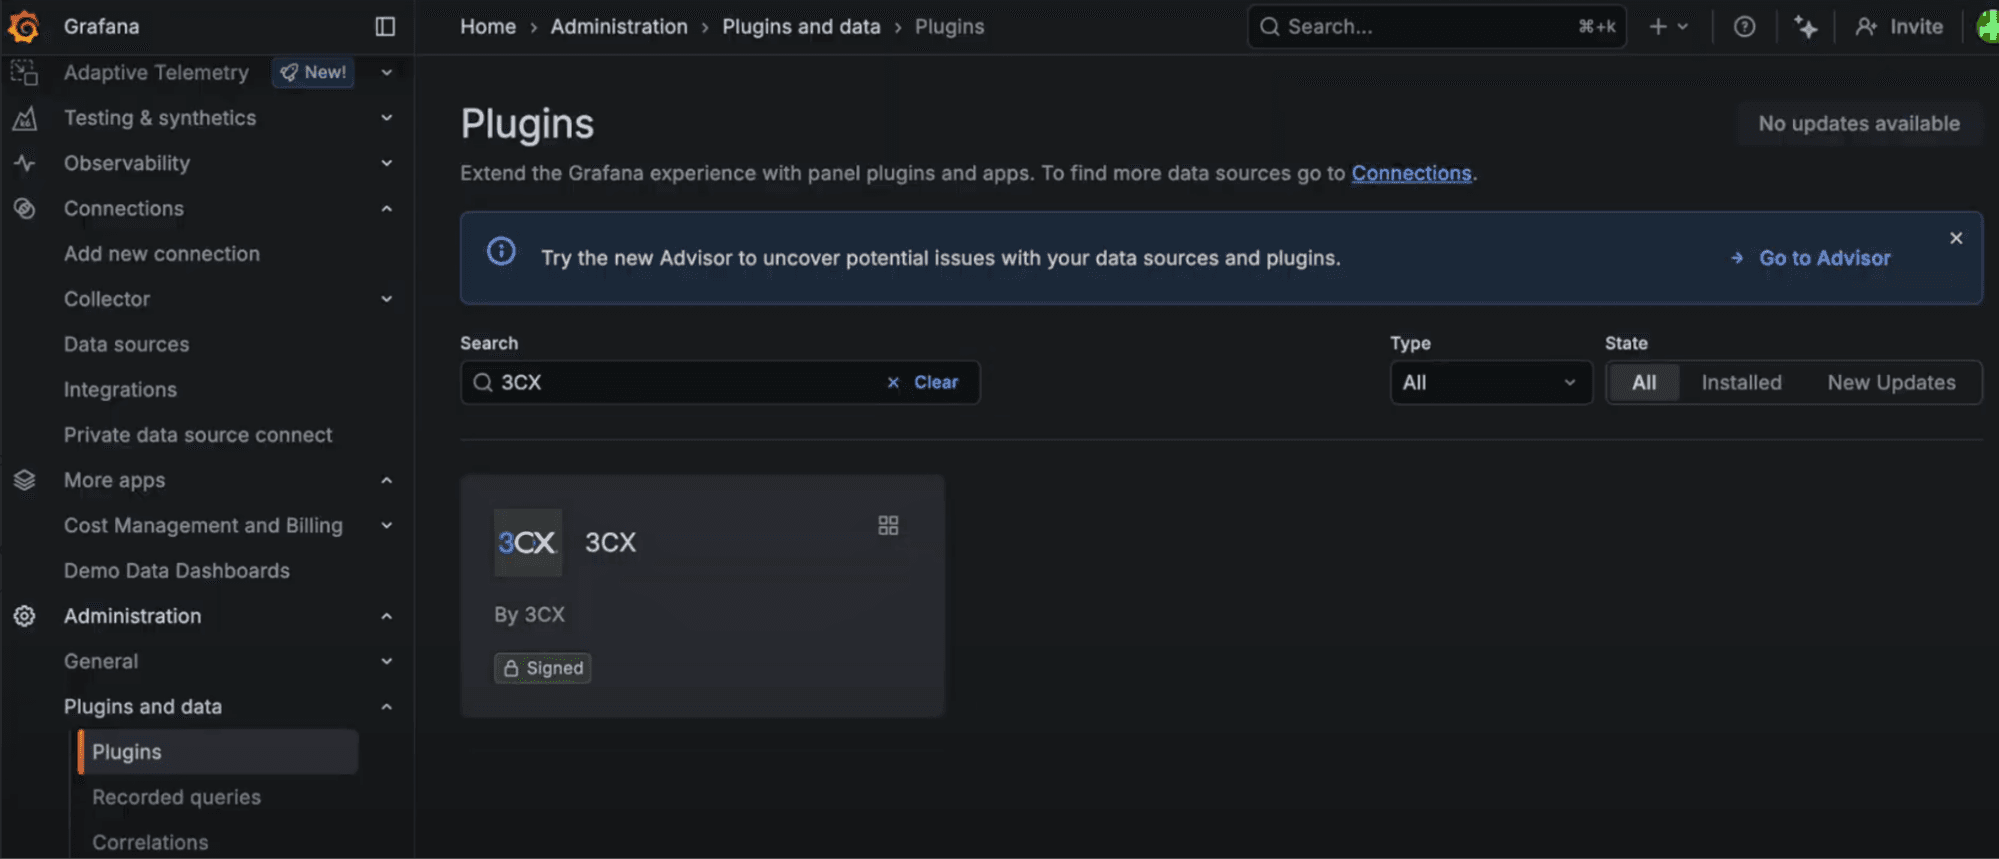
Get started with the 3CX app plugin for Grafana
You can install the plugin directly from the Grafana plugin catalog, or enable it from within your Grafana OSS or Grafana Cloud instance.
Once installed, use one of the follow guides to connect your preferred 3CX-supported database:
These guides walk through setting up the database, creating credentials, enabling the connector, and validating data flow. The provisioned dashboards will be available and populated with data automatically.
We look forward to evolving this application plugin within the Grafana and 3CX communities, and continuing to improve visibility into your contact center phone system.