

Beep boop: How to visualize Grafana Cloud IRM alerts in the real world
You know the situation: You're in a meeting and your alerts start to go off, but no one on the other side of the camera knows why you have to abruptly drop from the call.
What if, instead, you had a robot in the background of your Zoom meeting that started to blink when those same alerts went off? You could just point to it, type in the chat "I have to drop," and off you'd go.
Now, you might be asking yourself, "Why?" when you should really be asking yourself, "Why not?!"
Read along for all you need to know to make a robot (because robots) bring your most important alerts to life with the help of an ESP32 and Grafana Cloud IRM.
Getting your IoT alarm ready
To build our IoT alarm you will need an API key, somewhere to run an MQTT broker, an ESP32, a SparkFun Qwiic LED, and a toy robot to put the device in.
Get an API key
In your Grafana dashboard navigate to Administration -> Users and Access -> Service Accounts and create an API key for your monitoring process. You want to grant the account "Alerting: Full read-only access."
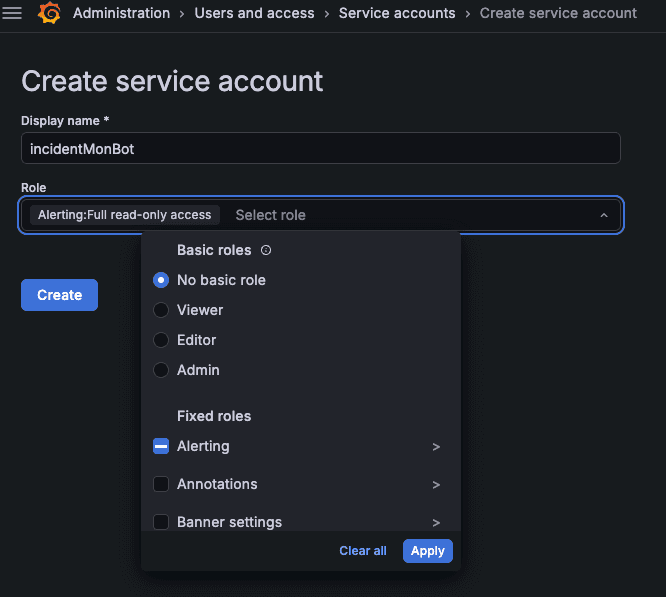
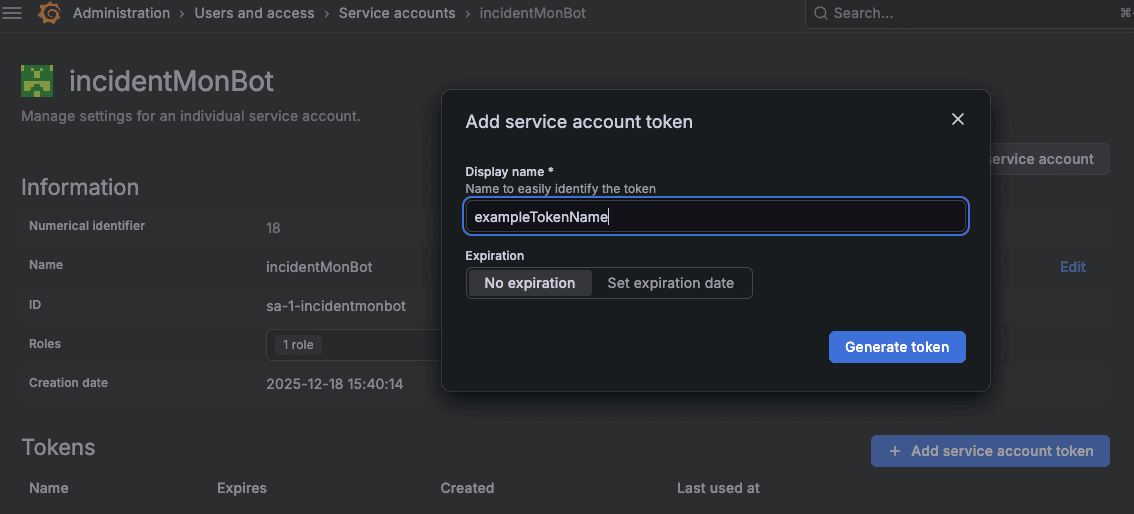
On the following page create a token by clicking on the button that reads “Add service account token”:
Hardware preparation
My alerting device was an ESP32 Pro Micro from SparkFun Electronics and a Qwiic LED Stick.
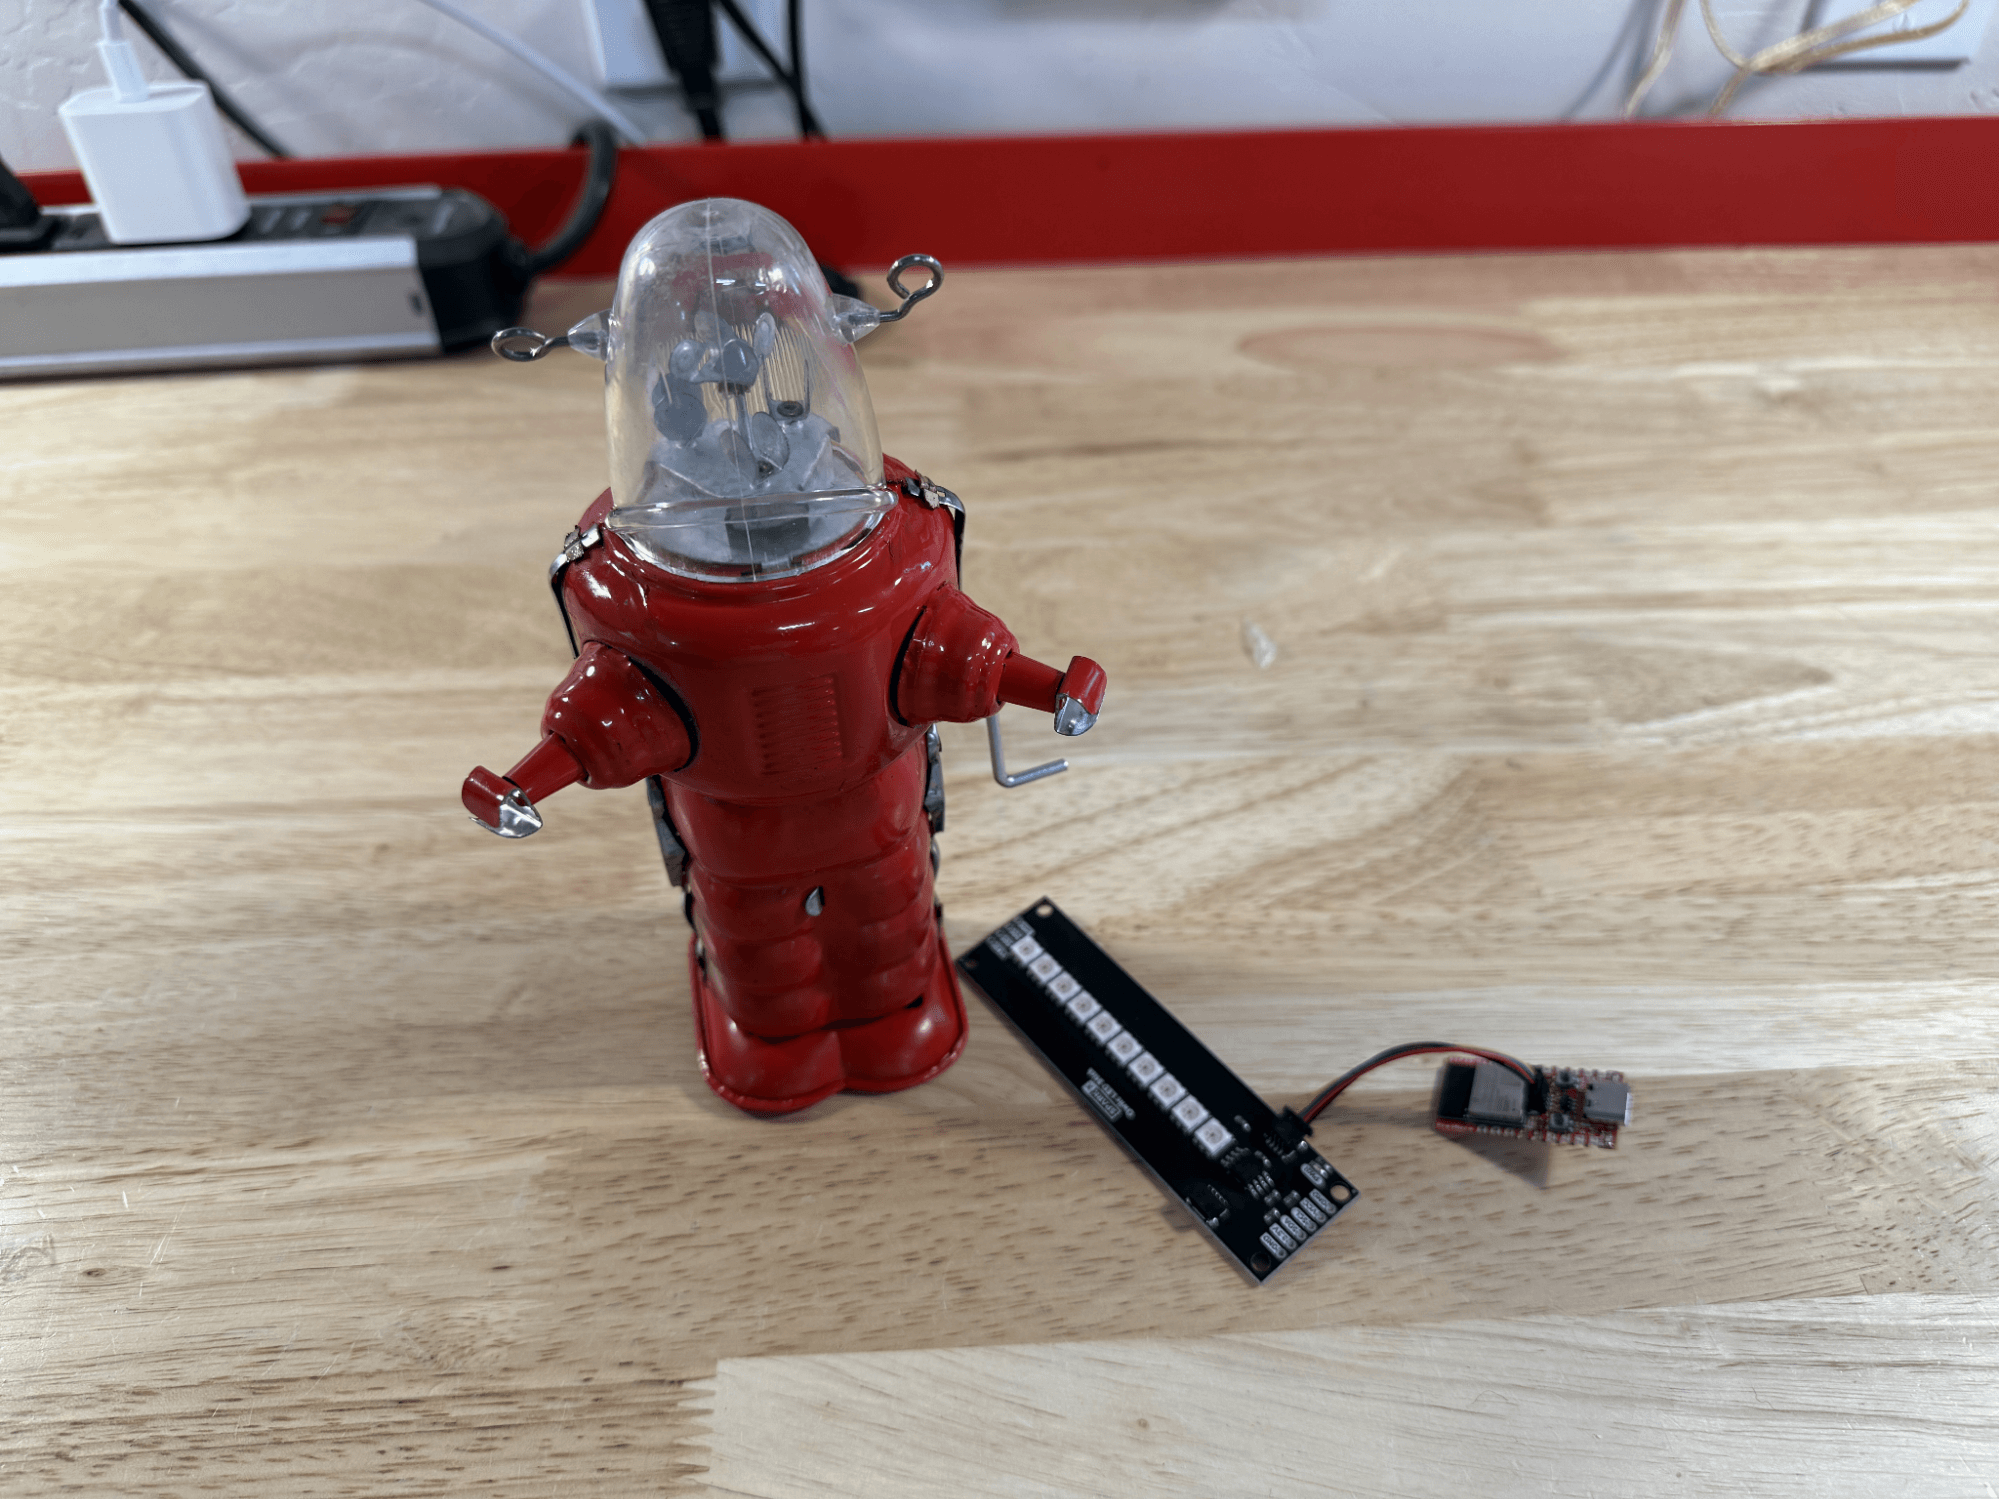
These IoT components were chosen for a few reasons. Sparkfun is an open source company like Grafana Labs and the Qwiic ecosystem makes hardware projects so much easier. I love getting out my soldering iron, reading spec sheets and looking for the right resistor… when I have time. Also, the Qwiic standard uses a 4 pin JST connector, allowing boards to be connected and even daisy chained with just a cable.
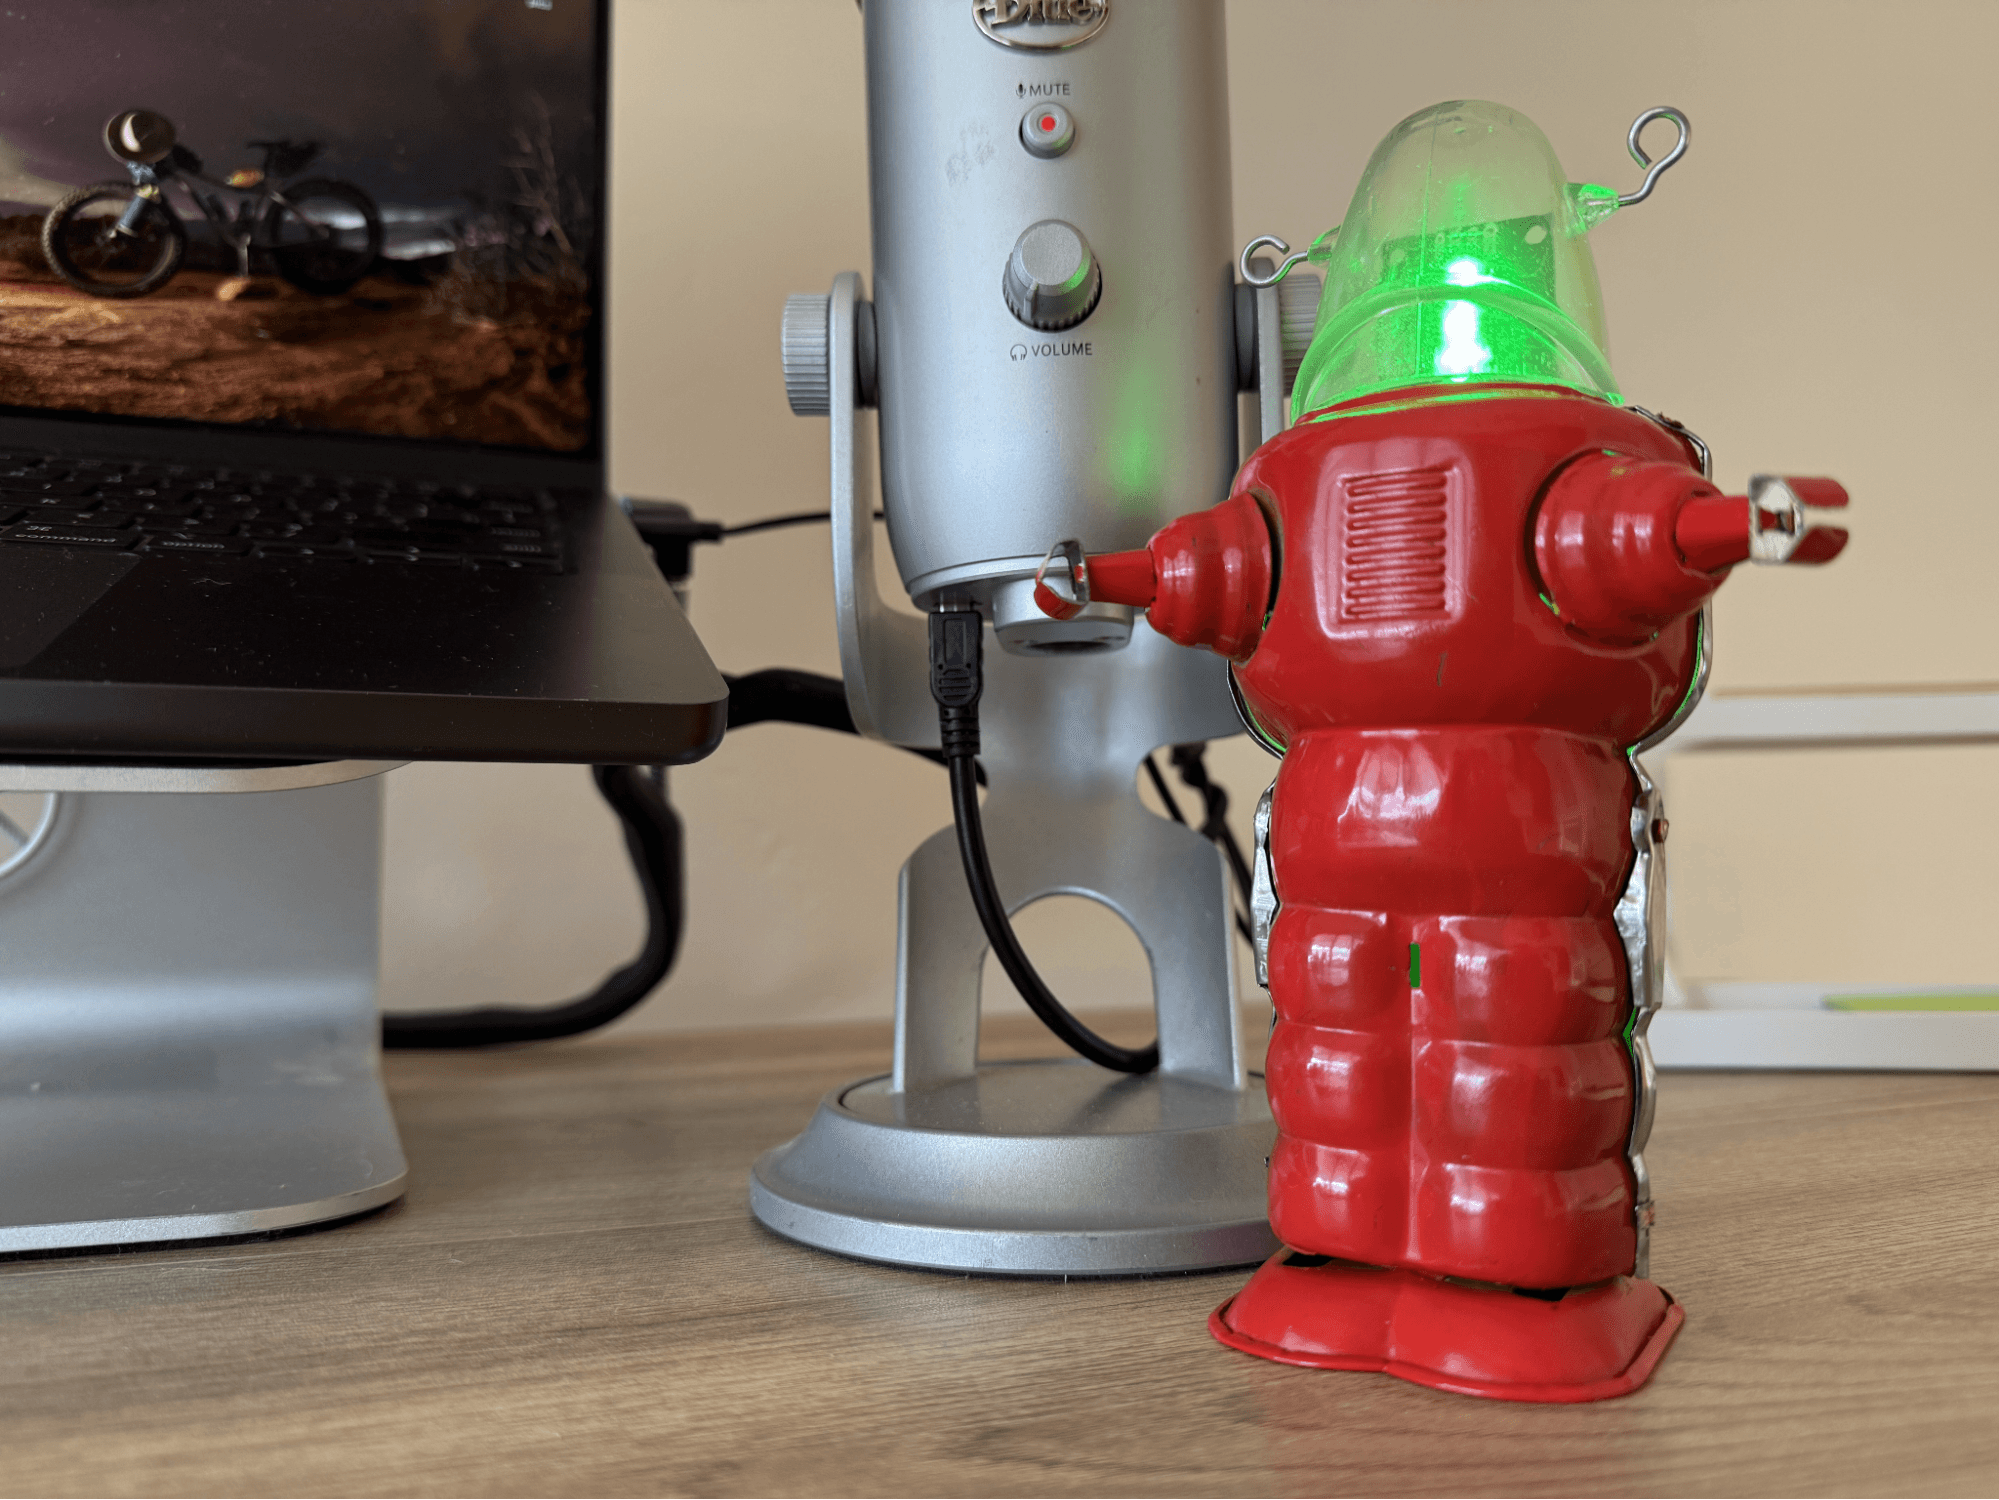
The toy robot was purchased from a seller on Etsy, but any toy will do.
I gutted the robot and glued the LED stick and ESP32 in place. This particular robot was chosen because of the large clear dome, making the lights visible.
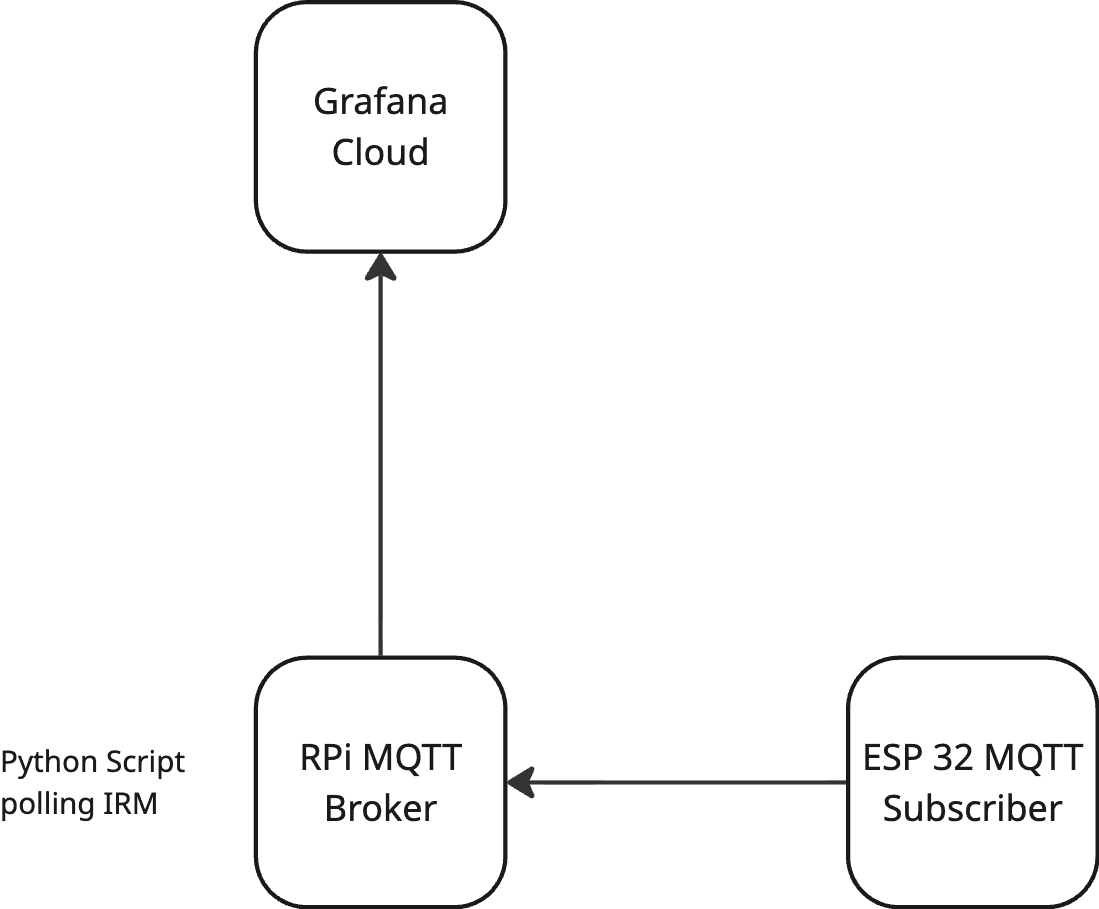
The system consists of three parts:
- The Grafana Cloud IRM service (If you don't already have an account, you can sign up for a free one today)
- A Python process running on a Linux box
- The ESP32 running in the toy robot
I ran the IRM Python script on a Raspberry Pi running Ubuntu 24.04. This script polls the IRM API regularly, and if a new incident is discovered it updates the MQTT broker (Mosquitto), which the ESP32 is subscribed to.
1. Copy the Python code from https://github.com/joemcmanus/incidentMon to your Raspberry Pi or Linux server.
2. On the Linux box you will want to install Mosquitto for the MQTT broker. The following command works for Ubuntu:
sudo apt install mosquitto mosquitto-clients
3. Copy the Python files and .cfg into a folder. For this example I used home/joe/incidentMon. Edit the .cfg to have your URL and your token. Leave the token blank and it will be accessed via an environment variable IRM_TOKEN.
4. To have it start on boot, move the file incidentMon.service to /lib/systemd/system and then enable the service.
joe@rpi:~/incidentMon# sudo cp incidentMon.service /lib/systemd/system
joe@rpi:~/incidentMon# sudo systemctl enable incidentMon.service
joe@rpi:~/incidentMon# sudo systemctl status incidentMon
ESP32
As mentioned above, I used a SparkFun Pro Micro - ESP32-C3wifi as the device, with a SparkFun Qwiic LED. Using the Arduino IDE you will load the .ino found in the GitHub repo into the board and update the SSID, Wi-Fi password, and MQTT broker IP to meet your environment.
joe@rpi:~/incidentMon# mosquitto_pub -t ledOne -m "0" #Turns off all lights
joe@rpi:~/incidentMon# mosquitto_pub -t ledOne -m "1" #Turns all lights blue
joe@rpi:~/incidentMon# mosquitto_pub -t ledOne -m "2" #Turns all lights green
joe@rpi:~/incidentMon# mosquitto_pub -t ledOne -m "3" #Turns all lights yellow
joe@rpi:~/incidentMon# mosquitto_pub -t ledOne -m "4" #Turns all lights red
joe@rpi:~/incidentMon# mosquitto_pub -t ledOne -m "5" #Turns all lights white
Python troubleshooting
If you want verbose output you can pass --debug(1|2)
--debug=1 will output config settings.
--debug=2 will output config + dump JSON + print the token in use
Python options
The easiest way to get information on the incident monitor is to pass the --help option. This will print out the proper syntax as well as detailed help.
joe@rpi:~/incidentMon# ./incidentMon.py --help
usage: incidentMon.py [-h] [--debug DEBUG] [--pid] [--config CONFIG]
                      [--delay DELAY]


Grafana IRM Monitor


optional arguments:
  -h, --help       show this help message and exit
  --debug DEBUG    Turn on debug mode, levels 0-2,0=none, 1=info,2=dumps json
  --pid            Create a pid file in /var/run/incidentMon.pid
  --config CONFIG  Override config file location, default ./incidentMon.cfg
  --delay DELAY    Specify delay between checks, default 60s
  --mqtt MQTT      Enable MQTT, default true
  --security       Only act on Security incidents, ignore everything else
joe@rpi:~/incidentMon# ./incidentMon.py --mqtt=false --security
Token handling
You probably don't want to store your API key (token) in plain text—that would expose a secret and we all know that is bad. You can use the environment variable IRM_TOKEN to store the API key.
And that's it! From here, have some fun with things. Try making the physical alarm something more interesting like a police siren or a jack in the box. Incident response is stressful enough, but hopefully this can at least bring a smile to your face the next time your alarms go off.
Grafana Cloud is the easiest way to get started with metrics, logs, traces, dashboards, and more. We have a generous forever-free tier and plans for every use case. Sign up for free now!

