

Grafana 12.3 release: Interactive learning experiences, new and improved logs visualizations, and more
Grafana 12.3 is here, delivering new features for interactive learning, deeper insights into logging data, and so much more. Overall, a big theme in the latest minor release is to make data exploration easier, faster, and more customizable.
Below are just some of the highlights from Grafana 12.3. If you want to explore all the latest updates, please refer to the changelog or our What’s New documentation, and be sure to check out the TL;DR video below.
Note: Grafana 12.3 also includes a critical severity security fix for CVE-2025-41115.

Interactive Learning: an easier way to find the resources you need
Available in public preview in all editions of Grafana
Whether you’re exploring dashboards, configuring data sources, or building panels, we want you to be able to get the guidance you need quickly and easily in Grafana. Because let’s be honest: finding the right documentation at exactly the right time can sometimes be tricky.
That’s why we’re rolling out Interactive Learning in Grafana, a new experience that brings learning resources directly into the Grafana platform. You can access step-by-step tutorials, videos, and relevant documentation right within your workflow to find the answers you need — no context switching required.

Accessed through the help icon in the UI, Interactive Learning provides context-aware guidance based on where you are and what you’re doing in Grafana.
To try it out today, enable the interactiveLearning feature toggle.
Gain deeper and faster insights into logs
Logs visualization is a core capability of Grafana, helping you display and analyze log records, correlate logs with other data, and ultimately troubleshoot faster.
With this release, we’ve completely rebuilt the logs visualization from the ground up, whether you’re working with LogQL or using Grafana Logs Drilldown, an application that lets you explore your logs without having to write queries.
The updates below help improve performance and introduce new features and display options to deliver the best possible log browsing experience.
Redesigned logs panel
Generally available in all editions of Grafana
First up, meet the new logs panel: faster, clearer, and built for discovery.

The revamped panel brings color highlighting, more flexible search, and an overall smoother experience to help you quickly find the “why” behind every log line.
- Logs highlighting: Add colors to different parts of your logs, making it easier to glean important context from them.
- Font size selection: There’s now a bigger font size by default, with an option to select a smaller font if you want it.
- Client-side search and filtering: Filter by level and search by string on the client side to find the logs you're looking for faster.
- Timestamp resolution: Logs are now displayed with timestamps in milliseconds by default, with an option to use nanosecond precision.
- Redesigned log details: When you want to know more about a particular log line, there’s a completely redesigned component with two versions: inline display below the log line, or as a resizable sidebar.
- Redesigned log line menu: The log line menu is now a dropdown menu on the left side of each log line, allowing you to access logs context (more on that below), toggle log details, copy a log line, copy a link to log line, and to explain in Grafana Assistant, our AI-powered agent in Grafana Cloud.
Broader context around logs
Experimental in all editions of Grafana
Following the completely redesigned logs panel, we’ve also rebuilt logs context, improving existing features and enabling new capabilities. Logs context is a feature that lets you view the surrounding events before and after any log entry, so you can spot patterns, root causes, and ripple effects faster.
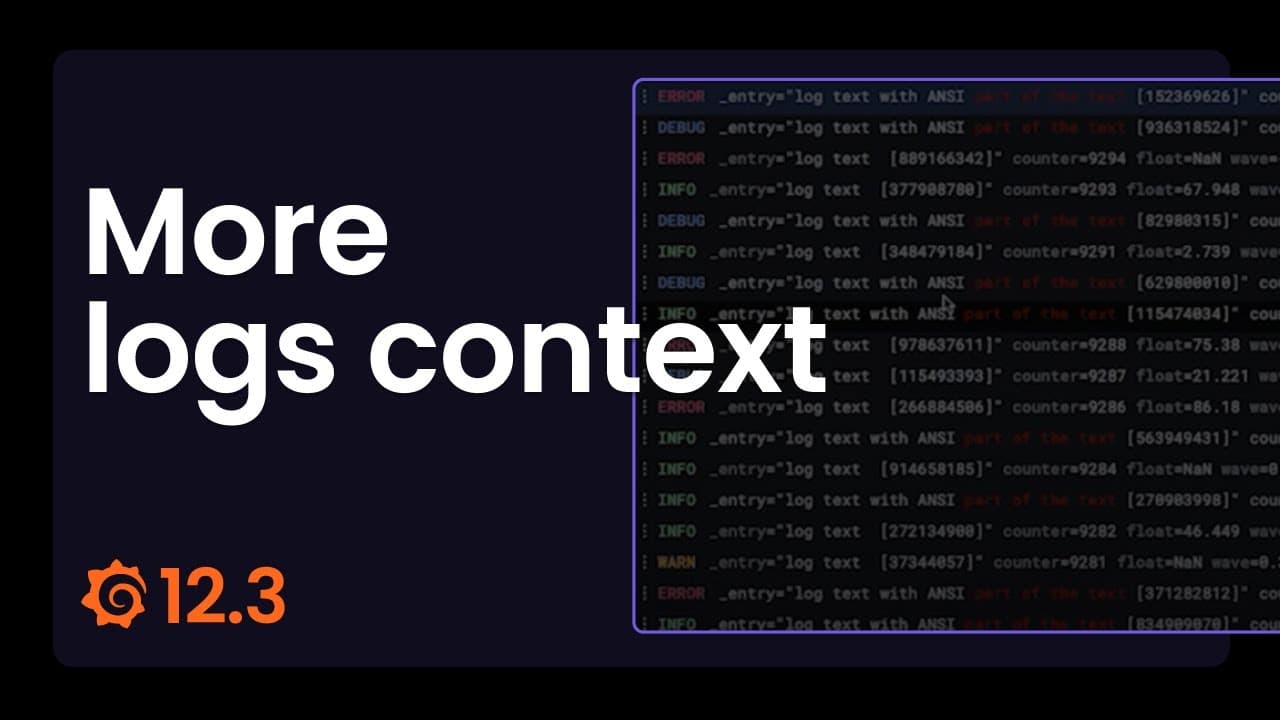
The logs context component now takes advantage of all the new options and capabilities in the redesigned logs visualization, and introduces the option to select the specific amount of time before and after the referenced log line, which ranges from a hundred milliseconds up to two hours.
New field selector component for logs
Generally available in all editions of Grafana
We’re also adding a new component to interact with fields in log lines, making it easier than ever to toggle fields on and off, reorder them instantly, and move from noise to insights faster.

Inspired by the analog component in the table visualization, the field selector displays an alphabetically sorted list of fields belonging to all the logs in display, with a percentage value indicating the amount of log lines where a given field is present. From this list, you can select fields to be displayed and change the order based on what you’d like to find.
To learn more about the logs visualization, please visit our technical docs.
Other data visualization updates for greater flexibility and control
Grafana 12.3 delivers a number of other updates designed to make data visualizations and dashboards faster to use, easier to share, and more focused on insights rather than setup.
Consolidated panel time settings and time comparison
Available in public preview in all editions of Grafana
The new panel time settings drawer gives you greater control over time ranges and shifts at the panel level without editing the dashboard.

The settings available in the drawer are:
- Panel time range: Override the dashboard time range with one specific to the panel.
- Time shift: Add a time shift in the panel relative to the dashboard time range or the panel time range, if you’ve set one.
- Time comparison: Compare time series data between two time ranges in the same panel.
- Hide panel time range: Hide panel time range information in the panel header.
The time comparison feature, in particular, was a request from the community, and allows you to easily perform time-based (for example, month-over-month) comparative analyses in a single view. This eliminates the need to duplicate panels or dashboards to perform trend tracking and performance benchmarking.
To access the panel time settings drawer, click the panel menu and select the Time settings option.
Exporting dashboards as images
Generally available in all editions of Grafana
Just built a beautiful Grafana dashboard that you can’t wait to share? We can relate. Now, you can quickly and easily export any dashboard as a PNG image to embed in a chat, presentation, or email — no manual screenshots required.
Simply select the Export as image option to generate an image, see a preview, and then download the image.
New Switch template variable type
Generally available in all editions of Grafana
The new switch template variable type lets you quickly toggle between query values for faster insights and smoother workflows.

Configure any two values — true/false, 1/0, yes/no, or custom pairs — and control boolean states across your dashboard with a single click. This feature is perfect for toggling debug modes, filters, or any conditional logic.
To get started, add a new variable with the Switch type in your dashboard settings. For details, refer to our docs.
Styling table cells using CSS properties
Generally available in all editions of Grafana
You can now style table cells with CSS properties with the Styling from field cell option. Using JSON object syntax with CSS properties, apply that styling to your table cells to color, highlight, and format your data to guide attention where it matters most.

Extending Grafana: what’s new in data sources
We believe you should be able to query and visualize your data, regardless of where that data lives. As a result, we’re always working to expand and enhance our line-up of Grafana data sources.
Here’s a look at the latest updates.
Visualize SolarWinds data
Available in public preview in Grafana Cloud and Grafana Enterprise
SolarWinds is a network and infrastructure monitoring platform that helps you monitor and manage network performance, server health, and application availability.

Now, with the new SolarWinds Enterprise data source for Grafana, you can query and visualize key infrastructure metrics such as CPU load, memory usage, and active alerts directly within Grafana dashboards. This integration allows teams to correlate infrastructure health with application performance, enabling proactive monitoring and faster incident response across hybrid and multi-cloud environments.
Detect log anomalies and patterns with the Amazon CloudWatch data source
Generally available in all editions of Grafana
Amazon CloudWatch is the AWS native monitoring and observability service that collects, aggregates, and stores metrics, logs, and events from AWS resources, applications, and services. The Amazon CloudWatch data source in Grafana extends these capabilities by allowing you to query CloudWatch data and create rich, interactive visualizations that can be correlated with data from other systems.
With the new log anomalies and log patterns features, you can detect abnormalities in your service and group log entries with recurring patterns.
Detecting log anomalies
You can now list the log anomalies in your service directly in Grafana. CloudWatch Log Anomaly detection is a new query type for this data source that leverages machine learning and pattern recognition to establish baselines of typical log content.

You can also use the Logs Insights query editor and the anomaly command to define and display log anomalies ad-hoc. See CloudWatch Logs Insights documentation for more on anomaly detection.
Detecting log patterns
Group log entry messages (or other string values) matching specific patterns with the patterns command, using any CloudWatch Logs query language. The associated diff command compares the log events found in your requested time period with the log events from a previous time period of equal length, returning results that describe the change.
We have added language support for both commands to CloudWatch Logs Insights language editor. More info can be found in the AWS Log Patterns documentation and the AWS Logs Insights syntax guide.
Securely access governed data with the Databricks Enterprise data source
Generally available in Grafana Cloud and Grafana Enterprise
The Databricks Enterprise data source for Grafana — which lets you visualize data from the Databricks open analytics platform — now supports the Databricks Unity Catalog, a unified governance solution for data and AI assets on Databricks.
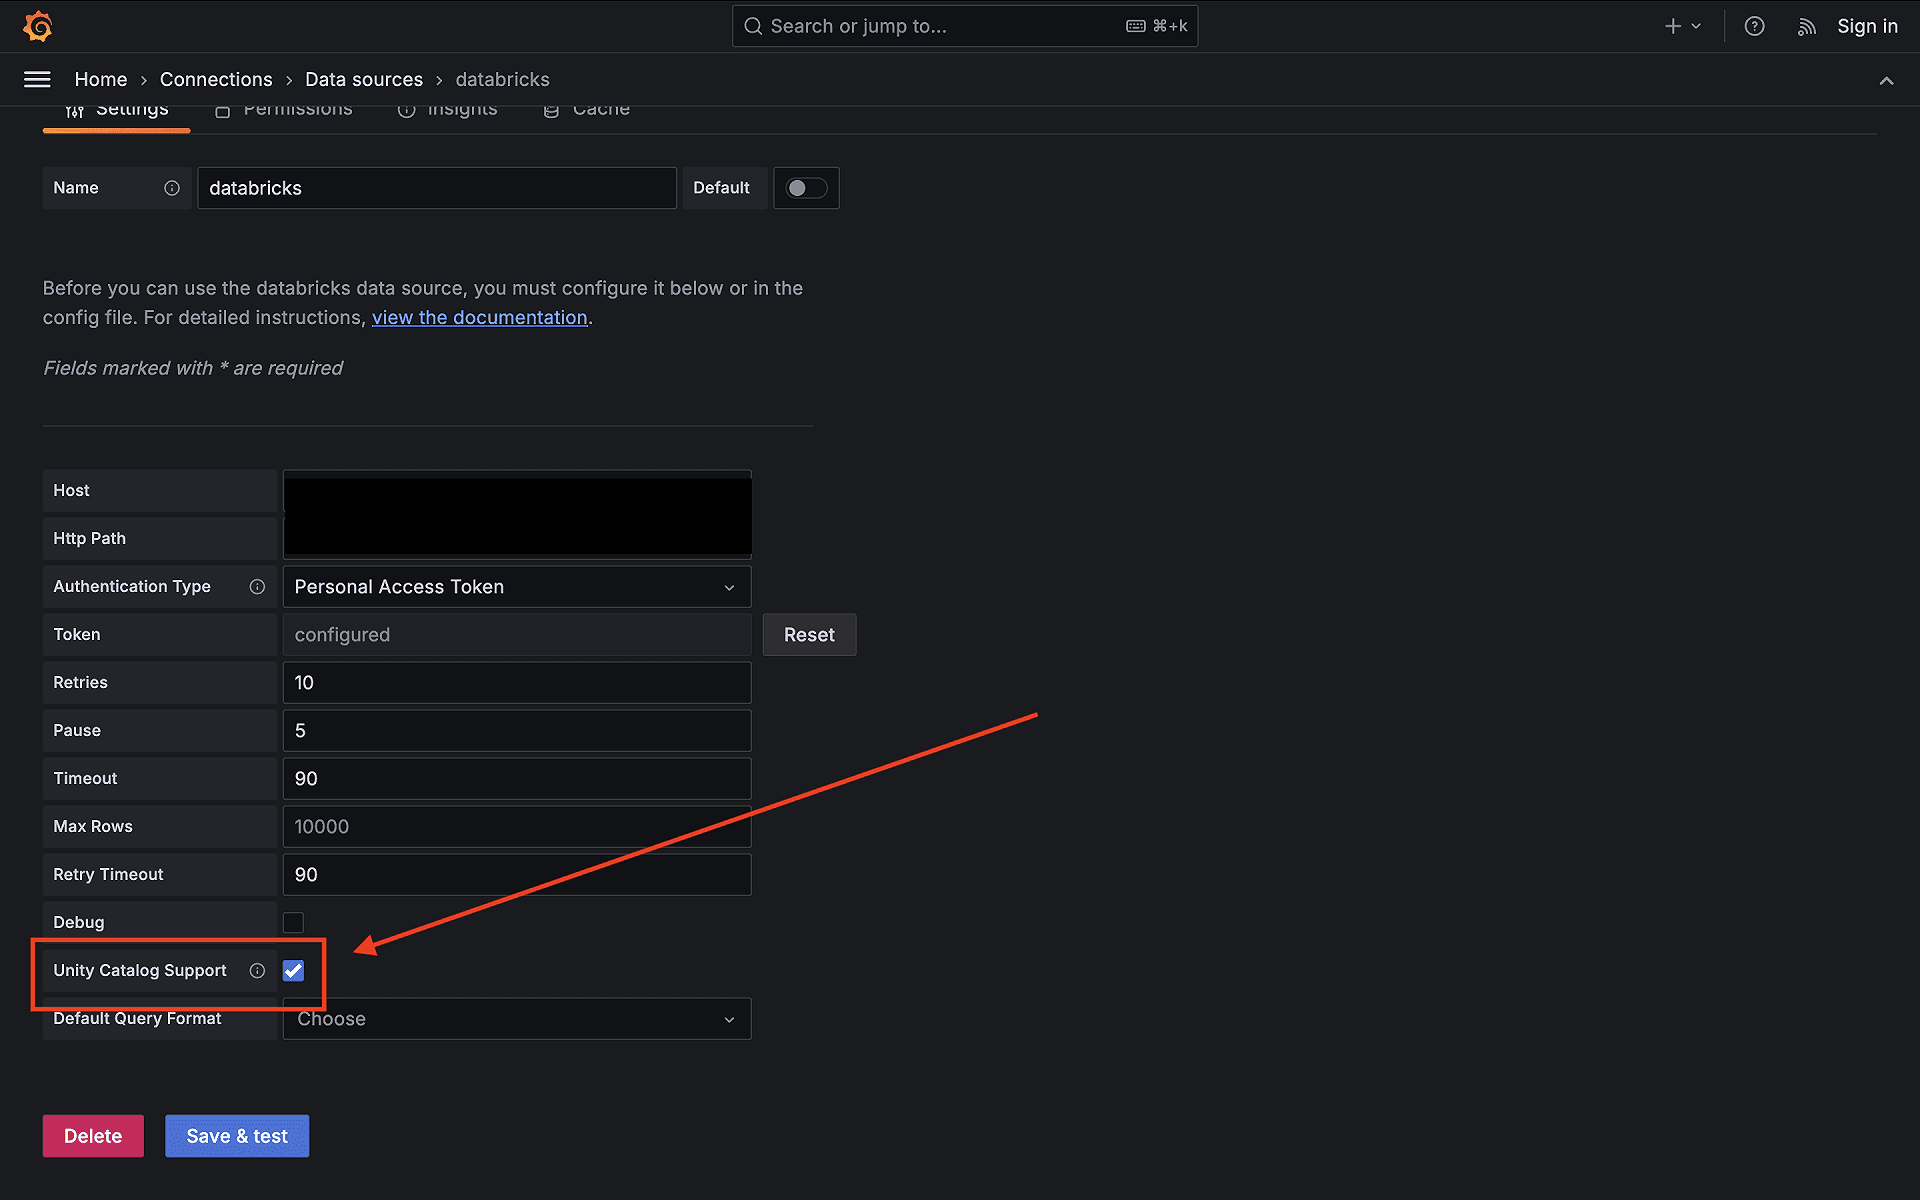
This enhancement allows you to easily query and visualize data sets registered in Unity Catalog while maintaining the same fine-grained permissions and lineage tracking defined in Databricks. With this integration, teams can build dashboards confidently, knowing their data follows centralized governance, access control, and compliance standards across all workspaces.
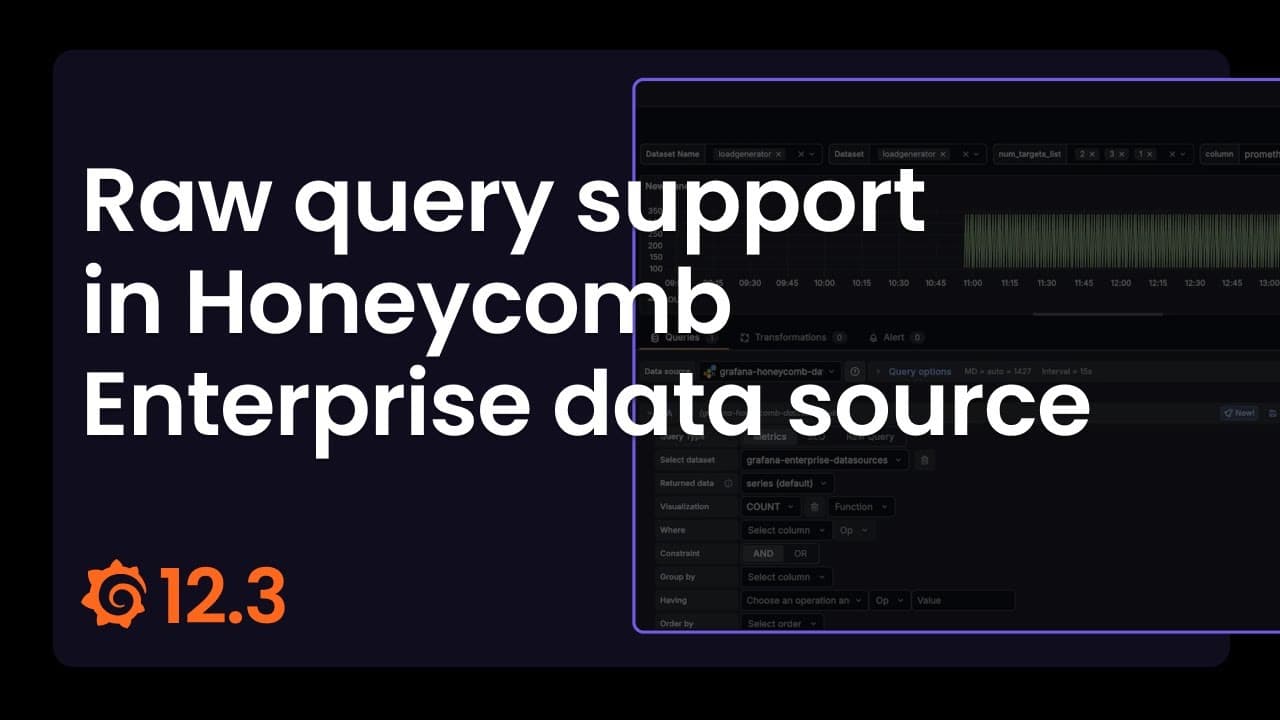
Use raw queries in the Honeycomb Enterprise data source
Available in public preview in Grafana Cloud and Grafana Enterprise
With our Honeycomb Enterprise data source for Grafana, you can query and visualize Honeycomb metrics and link to Honeycomb traces from within Grafana.
With our newly added support for raw queries, you can now take advantage of:
- Unrestricted querying: Gain full access to all Honeycomb API operations, including complex filters, aggregations, transformations, breakdowns, and more.
- Deeper insights: Craft highly specific and nuanced queries to extract the exact data you need, leading to more profound insights into application performance and system behavior.
This feature includes full support for variable substitution and automatic handling of array filters (e.g., with IN and NOT IN operators), making it easier to work with multi-value variables.
To add support for raw queries on-premises, enable the honeycombEnableRawQuery feature flag. If you are a Grafana Cloud user, please contact your support team to request access, and let us know what you think!
Writer queries faster in the OpenSearch data source
Generally available in all editions of Grafana
The OpenSearch data source for Grafana lets you visualize logs or metrics stored in OpenSearch, the community-driven, Apache 2.0-licensed open source search and analytics suite. The data source uses Piped Processing Language (PPL) and also supports AWS Sigv4 authentication for the Amazon OpenSearch Service.
Now, writing PPL queries in the OpenSearch data source is easier than ever, thanks to syntax highlighting, suggestions, and sample queries.
The PPL query editor now contains a multi-line box that supports syntax highlighting, PPL keywords and command suggestions, and index fields. To see the new features in action, select PPL in the Query type dropdown of the query editor and start typing.
Learn more about Grafana
For an in-depth list of all the new features in Grafana, check out our Grafana documentation, the Grafana changelog, or our What’s New documentation.
Join the Grafana Labs community
We invite you to engage with the Grafana Labs community forums. Share your experiences with the new features, discuss best practices, and explore creative ways to integrate these updates into your workflows. Your insights and use cases are invaluable in enriching the Grafana ecosystem.
Upgrade to Grafana 12.3
Download Grafana 12.3 today or experience all the latest features by signing up for Grafana Cloud, which offers an actually useful forever-free tier and plans for every use case. Sign up for a free Grafana Cloud account today.
Our Grafana upgrade guide also provides step-by-step instructions for those looking to upgrade from an earlier version to ensure a smooth transition.
A special thanks to our community
We extend our heartfelt gratitude to the Grafana community!
Your contributions, ranging from pull requests to valuable feedback, are crucial in continually enhancing Grafana. And your enthusiasm and dedication inspire us at Grafana Labs to persistently innovate and elevate the Grafana platform.
Grafana Cloud is the easiest way to get started with metrics, logs, traces, dashboards, and more. We have a generous forever-free tier and plans for every use case. Sign up for free now!

