

Grafana Tempo 2.9 release: MCP server support, TraceQL metrics sampling, and more
Grafana Tempo 2.9 is now available, delivering MCP server support, TraceQL performance improvements, and more.
Watch the video below to see the Tempo MCP server in action and learn how to speed up TraceQL metrics queries, or continue reading to get a quick overview of these and other updates. The Grafana Tempo 2.9 release notes and changelog provide more in-depth details and include all of the changes that came with this release.
Analyze tracing data with LLMs: MCP server support
Model Context Protocol (MCP) is an open source standard developed by Anthropic that defines how LLMs and AI assistants, such as Claude Code or Cursor, can securely connect to external data sources in a consistent way.
A couple months ago, we shared that Grafana Cloud Traces — the fully managed distributed tracing system powered by Tempo — includes MCP server support. And now, with the Tempo 2.9 release, we’re excited to extend this feature to our open source community, as well.
Tempo 2.9 now includes an MCP server that has direct access to your distributed tracing data through TraceQL queries and other endpoints. This means you can now leverage LLMs and other agents to more easily understand interactions between your services, as well as investigate and diagnose issues faster.
For instance, you could ask Claude to list all the services in Tempo.

MCP server support in Tempo is an experimental feature. For more information on MCP, as well as examples and how to get started with the Tempo MCP server, please refer to the MCP documentation, the Tempo release notes, and the Tempo community calls from June and August.
Speed up your queries: TraceQL metrics sampling
If you read our Tempo 2.8 release blog, you’re likely familiar with TraceQL query hints, which are special options you can add to a TraceQL query to modify how Tempo processes the request. With the 2.9 release, we’ve added a few more query hints, this time to let you speed up your queries by returning an approximate result using probabilistic sampling. This can be especially useful in environments with high data volume or long retention. While sampling can speed up your queries, the tradeoff is accuracy: it provides approximations that may deviate from the exact metric, as Tempo is only looking at some of the spans to extrapolate results.
The core query hints added in Tempo 2.9 include:
with(sample=true)with(sample=0.xx)
with(sample=true) enables dynamic sampling and is what we recommend using. If you need more control over the sampling behavior, with(sample=0.xx) enables fixed probabilistic sampling. For example, sample=0.01 inspects 1% of the data. If you need even more control than this, see the docs.
We can run the following two queries and see how they compare, as well as how long they take by checking the query inspector for each separate query.
{ } | rate()
{ } | rate() with (sample=true)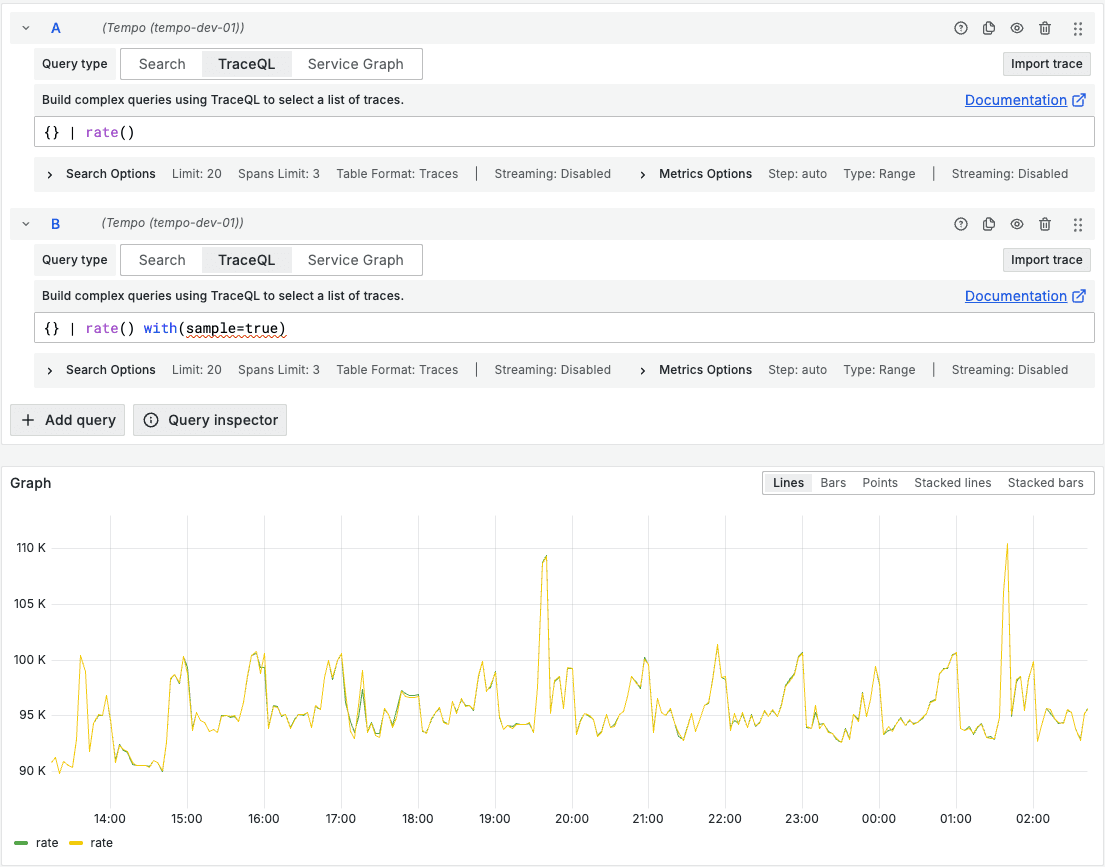
The green line represents query A, and the yellow line is query B with sampling. We can see that they look quite similar, but there is a noticeable difference in how long they took to run. When we didn’t include the query hint the total request time was 7.35 seconds; when we did include the query hint, the total request time was 2.89 seconds.
Note: if you don’t see much of a time difference when you include the query hint, it’s possible your query results have already been cached.
Please check out the docs, PR, release notes, and the August community call for more information on metrics sampling. And please let us know what you think about this feature so we can make any improvements if needed!
Operational improvements for multi-tenant environments
Tempo 2.9 includes several operational improvements, particularly for people who are running multi-tenant environments. These improvements make it easier to see how each tenant’s traces are performing and where problems might be, creating feedback loops to help improve tracing pipelines.
We highlight two of these improvements below, but please refer to the Tempo changelog and release notes for the complete list.
New metrics to monitor query I/O and span timestamp distance
A new query_frontend_bytes_inspected_totalcounter shows the total number of bytes read from disk and object storage. It provides visibility into I/O operations for monitoring query performance.
We also added two new histograms: one to count the number of spans with an end timestamp in the future, and one to count the number of spans with an end timestamp in the past:
spans_distance_in_future_secondsspans_distance_in_past_seconds
There are buckets for 300ms (5min), 1800s (30min), and 3600s (1hr).
The value of spans_distance_in_future_seconds should be zero. If this is not the case, there are invalid spans. These spans might not be found using the search API, so this metric is especially useful to detect issues, such as surface clock skew and how badly they’re skewed.
Check out our docs for more information and examples.
Support for scope in cost-attribution usage tracker
In the cost-attribution usage tracker dimensions, you can now scope by resources with resource <attribute> to look only at resource-level attributes, and by spans with span.<attribute> to look only at span-level attributes.
Previously there was only <attribute> to look at both resource and span levels, but this could result in overwriting resource-level attributes if both exist. To see examples of this in use, visit the Usage tracker docs. You can also check out benchmark data in the PR.
How to learn more — and what’s next for Grafana Tempo
To see the full list of TraceQL performance improvements, bug fixes, and breaking changes in Tempo 2.9, please refer to the changelog and release notes.
Looking ahead, we are currently working on a new and experimental vParquet5 block format. We have merged a PR for low-resolution timestamp columns for improved TraceQL metrics performance and a PR for dedicated columns for integer values. We also expect there to be upcoming breaking changes. To learn more about the Parquet block format, see our docs. And to learn a little bit more about some of the changes, watch the August community call.
We are also working on a new Tempo architecture, codenamed Project Rhythm, which is currently experimental. The project aims to remove the replication factor 3 (RF3) requirement, decouple read and write paths for better scalability and reliability, and lay the groundwork for lower total cost of ownership and future growth.
If you are interested in hearing more about Grafana Tempo news or search progress, please join us on the Grafana Labs Community Slack channel #tempo, post a question in our community forums, reach out on X (formerly Twitter), or join our monthly Tempo community call. See you there!
And if you want to get even closer to where the magic happens, why not have a look at our open positions at Grafana Labs?
The easiest way to get started with Grafana Tempo is with Grafana Cloud, and our free forever tier now includes 50GB of traces along with 50GB of logs and 10K series of metrics. Sign up today for free!

