

ObservabilityCON 2025: A guide to all the announcements from Grafana Labs
Today at ObservabilityCON 2025 in London, we unveiled a number of exciting announcements and updates to Grafana Cloud that reimagine SaaS economics, simplify the complexity of running your observability stack at scale, and provide AI tooling that's actually useful. (Root cause analysis via chatbot? Yes, please!)
Check out the keynote to learn more about how we're helping you do more with the open observability cloud, and read on for a quick recap of all the news from ObservabilityCON 2025.

All the Grafana Cloud updates announced at ObservabilityCON 2025
Actually useful AI
We've integrated AI-powered capabilities into Grafana Cloud to help you resolve incidents faster, lower operational overhead, and make observability accessible to users of any skill level.
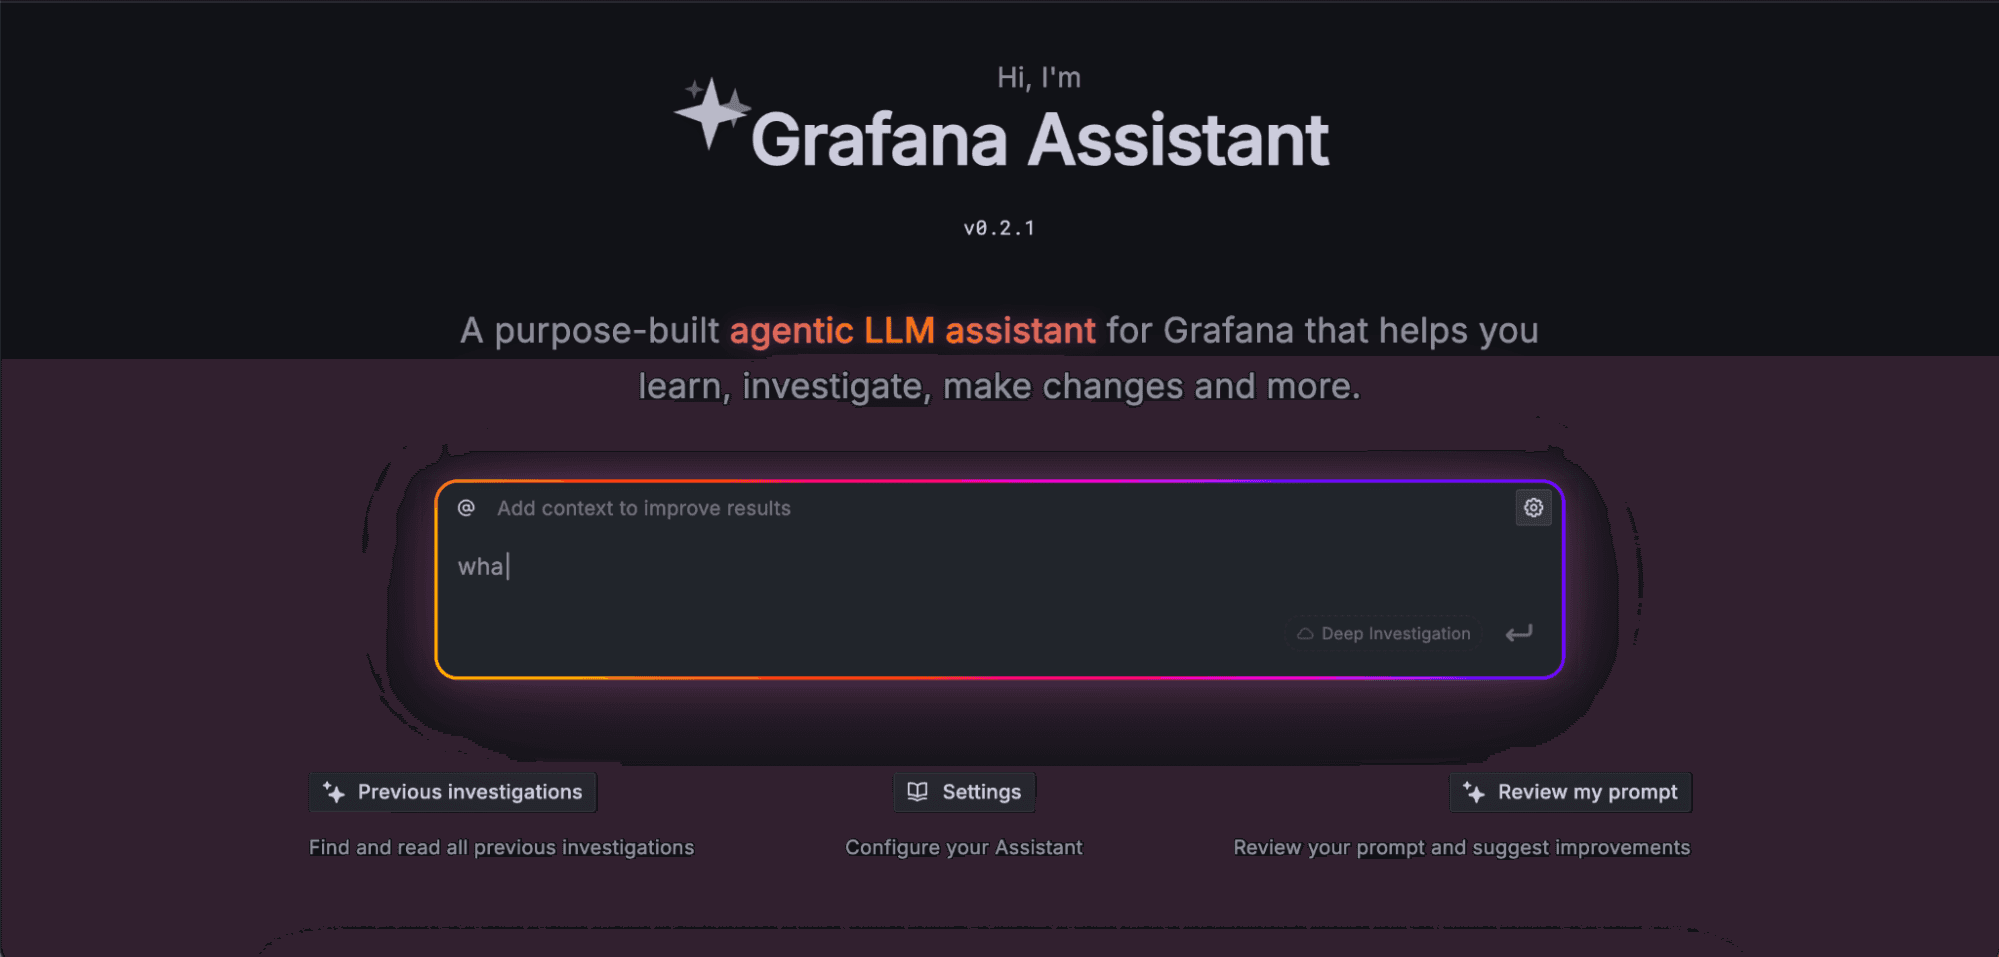
Grafana Assistant (now generally available) is a context-aware AI agent that helps you:
- Write and debug queries faster
- Build and optimize dashboards
- Investigate issues and anomalies
- Understand telemetry trends and patterns
- Navigate Grafana more intuitively, using natural language
At ObservabilityCON, the team also revealed that Assistant now supports profiles and MCP servers; provides in-product guides; and offers tailored RBAC controls.
We've seen a ton of excitement and engagement since we first announced Assistant at GrafanaCON 2025, and early users are already seeing measurable benefits.
“One of the biggest use cases for us is reducing the cognitive load on engineers,” said Neil Wilson, Director of Software Engineering, LexisNexis Risk Solutions. “Grafana Assistant helps us get to root cause faster—without needing deep expertise in every part of our complex system. That lowers training time and reduces risk if one of our experts leaves.”
And now we're taking it a step further with Assistant Investigations (in public preview), which uses specialized agents to analyze your observability stack, find anomalous behavior, and build a border picture of your system. It provides actionable recommendations for mitigation and remediation, and since it's embedded directly into Assistant, you get a seamless, guided workflow for resolving complex incidents.
To learn more, check out our blog post on Assistant and Assistant Investigations.
SaaS economics reimagined
It’s a frustrating and familiar challenge: observability costs keep rising, but the value of your telemetry data doesn’t keep pace. That’s why we made several announcements at ObservabilityCON intended to help you optimize observability costs, maximize the value of your data, and reduce operational complexity in cloud environments.
The expanded Adaptive Telemetry suite: cut costs, keep all the value
As telemetry volumes grow, it gets harder to separate signals from noise, and to control costs. That’s why we built Adaptive Telemetry in Grafana Cloud: a suite of features that analyze how your telemetry is used and automatically suggest actions like aggregating, sampling, dropping, or reducing low-value data. This helps you focus on the critical signals to keep systems running smoothly while lowering observability costs.
Our suite started with Adaptive Metrics and Adaptive Logs, and now we’re excited to share the general availability of Adaptive Traces and private preview of Adaptive Profiles.
Adaptive Traces: maximize the value of your tracing data
In modern distributed systems, tracing helps reveal bottlenecks and dependencies, but as it scales, costs climb and dashboards fill with redundant data from successful requests. Adaptive Traces in Grafana Cloud solves this with tail sampling—a technique where the decision to sample or drop a trace is made after collecting all or most of its spans—to ensure you only retain the insights that truly matter.
With custom policy management, anomaly detection, and an integration with Traces Drilldown, Adaptive Traces provides a powerful, closed-loop experience to cut through the noise and accelerate root cause analysis.

Adaptive Profiles: scalable continuous profiling without runaway costs
Adaptive Profiles in Grafana Cloud lets you scale continuous profiling across your infrastructure without the worry of cost overruns. By automatically dialing data collection up based on workload behavior, it delivers critical performance insights when they matter most while keeping everyday monitoring efficient and affordable.
Learn more about Adaptive Traces and Adaptive Profiles—and the Adaptive Telemetry suite, as a whole—in this blog post.
Centralized control over your observability spend
With the Cost Management and Billing app in Grafana Cloud (now generally available), admins get a centralized suite of tools to manage, control, and optimize their observability spend. By centralizing billing and usage information in one place, Cost Management and Billing is your one-stop-shop for attributing costs to teams and projects, managing invoices, and setting proactive usage alerts.

To learn more, please visit our Cost Management and Billing docs.
Grafana Bring Your Own Cloud (BYOC): leverage existing CSP discounts
We realize many of our users have existing discounts and credits with cloud service providers (CSPs) like AWS and Google Cloud. With Grafana BYOC, you can tap into all the benefits of Grafana Cloud, while still taking advantage of the special pricing agreements you have with your CSP.
To read more, please check out our Bring Your Own Cloud webpage.
Grafana Federal Cloud: secure and reliable observability
Grafana Federal Cloud (now generally available) is authorized at FedRAMP High and DoD Impact Level 5 (IL5), making the fully managed, highly scalable observability platform available to U.S. government agencies and contractors operating in highly regulated environments.
Grafana Federal Cloud offers organizations secure and reliable cloud-based monitoring for their infrastructure, applications, and services, ensuring data protection and compliance with stringent security standards.
Please visit our Grafana Federal Cloud documentation to learn more.
Complexity simplified
Observability has historically been costly, siloed, and difficult to scale, which is why we're adding new capabilities to help every engineer, from developers to SREs, reduce complexity and deliver reliability for enterprise workloads.
Full-stack observability, powered by the knowledge graph
With today's complex systems, you can't monitor applications or infrastructure in isolation—you need observability across your entire stack. That’s where the Grafana Cloud Knowledge Graph (formerly Asserts) comes in.

The knowledge graph connects metrics, logs, traces, and profiles across Application Observability, Frontend Observability, and Kubernetes Monitoring solutions in Grafana Cloud and combines the telemetry into a single intelligent map of a system's apps, databases, nodes, and more. The knowledge graph then provides you with:
- Unified, intelligent workflows: Automatically discover and map services and dependencies, surfacing curated dashboards and real-time health insights without needing deep PromQL expertise.
- Faster root cause analysis: Consolidates anomalies, dependencies, and timelines into a single view. It's also integrated with Grafana Assistant, so teams can turn 30-minute war rooms into three-minute diagnoses.
- Out-of-the-box insights: When used alongside Application Observability, the knowledge graph provides built-in intelligence for Kubernetes, databases, and cloud services, reducing alert fatigue, shortening MTTR, and empowering engineers to troubleshoot effectively.
- Centralized knowledge for your whole team: Integrate existing dashboards, alerts, and even tags from metrics directly into the knowledge graph so everyone in your team has shared understanding of system behavior and state during RCA.
To learn more about Grafana Cloud Knowledge Graph, check out our docs.
Service Center: a service-first view of system health
In the context of observability, a service is an individual or set of software functions. These services are dynamically derived from metric labels, but they can become difficult to track in distributed systems because those labels often differ once they're split across microservices, clusters, or regions.
But with Grafana Cloud Service Center, you can define your own static service label definitions, giving your team one view to organize and support a given service. This helps you define ownership and track service health and performance better. With Service Center, you get:
- Inventory: This landing page contains all Grafana Cloud resources related to the specific service, with links to jump into the pre-filtered view of those product areas.
- Operational review: Teams can view historical summary information based on SLOs, alerts, incidents, and Grafana Cloud IRM pages. They can then use the data to gauge service performance over a set period of time to help continuously improve operations and reliability.

The latest updates to Service Center include a historical view of firing alert rules and alert instances. We've also added historical views of mean time to resolve, mean time to respond, alert group ownership by user, and pages by data source.
To learn more, check out our Service Center docs.
Coming soon in public preview: Database Observability and Instrumentation Hub
The majority of application performance issues start in the database, yet traditional tools stop at “the database is slow.” But with Database Observability in Grafana Cloud, you can break open the black box and get query-level visibility and AI-powered optimization so database troubleshooting is faster and easier.

You can use Database Observability to track every query across your databases and easily correlate queries with app and infrastructure signals. Plus, you can drill into execution plans, schema details, and indexes to pinpoint inefficiencies, and you get AI-powered recommendations with ready-to-run code.
Database Observability will be available in public preview soon. Join the waitlist to be notified when it’s available.
Also coming soon: Instrumentation Hub, a point-and-click experience that allows you to automatically discover instrumentation gaps and deploy observability coverage at scale.
Click here to sign up for early access.
Celebrating Grafana Labs partners
This year at ObservabilityCON we held our first-ever Grafana Labs Partner Summit, where we celebrated the incredible impact of our partner ecosystem with our inaugural Grafana Labs Partner Awards.
The 2025 awards recognized excellence across revenue impact, new customer acquisition, sales collaboration, enablement, and customer success, spotlighting the partners who have truly set the bar in delivering value alongside Grafana Labs and helping shape the future of observability. You can check out the winners in each category in the image below:

The Partner Summit also provided a dedicated forum to strengthen alignment with our partners by sharing strategic updates, upcoming initiatives, and new opportunities for co-marketing and go-to-market collaboration.
You can learn more about partnership opportunities with Grafana Labs by visiting this page.
And check out the ObservabilityCON 2025 homepage for all the latest from Grafana Labs' flagships observability event!

