

Actionable insights into the end-user experience: an overview of Grafana Cloud Frontend Observability dashboards
One of the biggest challenges in frontend development is identifying when and why users encounter performance issues, whether it’s slow page loads, JavaScript errors, or failed HTTP requests.
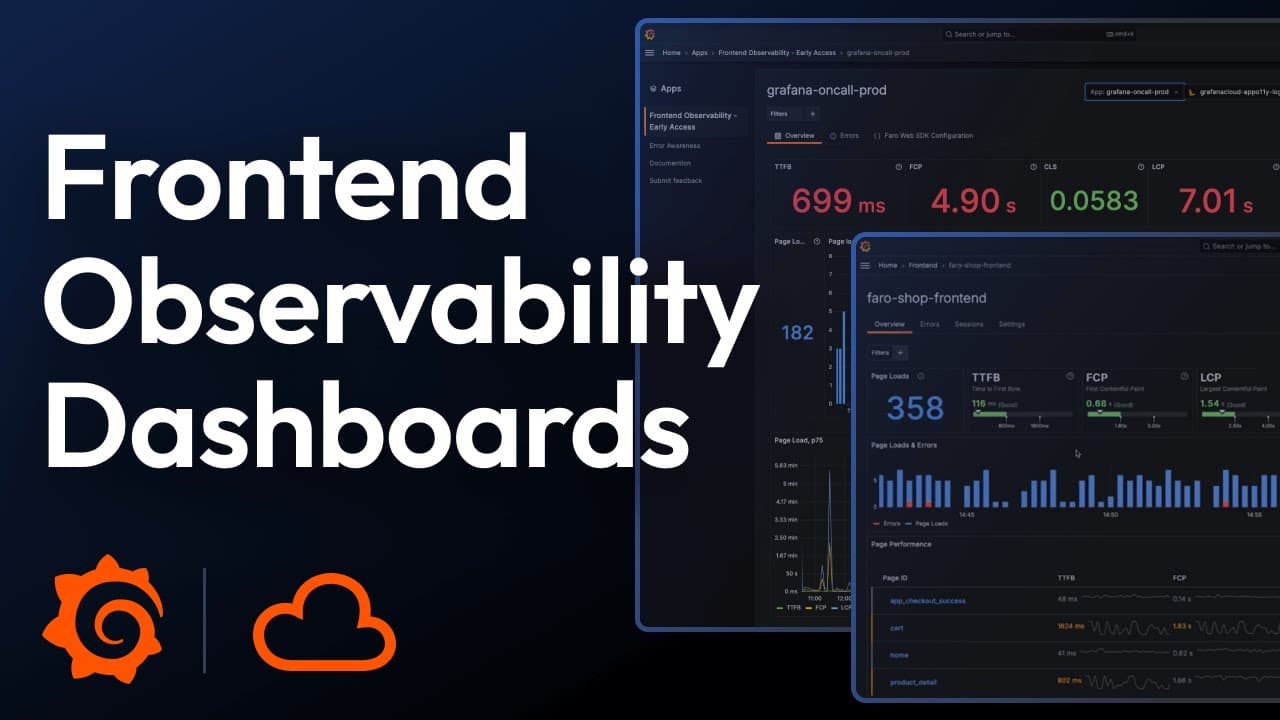
With Grafana Cloud Frontend Observability — a hosted service for real user monitoring (RUM) — you get immediate, clear, and actionable insights into the end-user experience of your web applications. Frontend Observability leverages performance data collected by the Grafana Faro Web SDK, and presents it through pre-built dashboards and analytics tools, so you can quickly gain the insights you need.
In a previous blog post, we discussed how to analyze Core Web Vitals in Frontend Observability dashboards. In this post, we’ll walk through other key sections of the pre-built Frontend Observability dashboards, including those for page loads, page performance, sessions, errors, and HTTP requests. You can also learn more and follow along visually by watching the YouTube video below.
Key components of a Grafana Cloud Frontend Observability dashboard
Frontend Observability dashboards allow developers to gain real-time insight into how users experience their applications. Each dashboard section works together to provide a complete picture of frontend performance.
Page Loads
The Page Loads section provides insights into the user experience by measuring how long it takes entire pages to load within your application. You'll see the total number of page loads within your selected timeframe, along with a distribution chart that separates successful loads (blue) from error encounters (red).
 You can use this information to gauge how well a page is loading and what JavaScript errors may be occurring. Page loads can also help you understand the time intervals during which your users are most and least active.
Page Performance
The Page Performance section breaks down performance by individual page IDs, which are auto-generated by the Grafana Faro Cloud receiver — a component in the Grafana Cloud architecture that accepts telemetry data from the Grafana Faro Web SDK. You also have the option to override page IDs when you instrument your app.
 Each page displays its own Core Web Vitals and error metrics using an intuitive color system: red indicates poor performance, yellow suggests areas needing improvement, and green represents good performance.
Clicking into specific pages reveals detailed information, including associated session IDs and comprehensive logs. This granular approach helps you prioritize optimization efforts by identifying which pages most urgently need attention.
Errors
The Errors section provides a distribution of errors over time, as well as an aggregated list of top errors, top errors by page ID, and top errors by browser. When you drill into specific errors, you'll find stack traces, detailed error messages, and metadata that helps streamline the debugging process.
 You can also access session data directly from error details to create a direct path from the identified problem to the user impact, making root cause analysis more efficient and thorough.
Sessions
Every user visit to your application generates a unique session ID that tracks the complete user journey from entry to exit or timeout. The Sessions section displays session amount over time, segmented by page ID, along with a comprehensive table showing timestamps, errors, browser information, and session lifecycle data.

HTTP Performance Insights
The HTTP section — also known as HTTP Performance Insights — focuses on the health and performance of your application's HTTP requests. You'll see total requests, error rates, error percentages, average Time to First Byte (TTFB), and other request-related metrics that impact overall application performance. This feature is currently in public preview.
Filters: customizable data analysis
Available across all sections of Frontend Observability dashboards, filters allow you to slice and dice your data using both custom tags created during Faro instrumentation and preconfigured options.
 Whether you need to analyze specific app environments, compare different versions, or focus on particular user segments, filters provide the granularity needed for targeted analysis.
Learn more
These metrics and visualizations in Frontend Observability are designed to help you monitor the health of your web applications and ensure the best possible end-user experience. To learn more, please refer to our documentation.
And to see a live, interactive example of Grafana Cloud Frontend Observability, please check out Grafana Play.
Lastly, while Frontend Observability shows you how real users experience your application, how do you proactively monitor issues before they reach users? Grafana Cloud Synthetic Monitoring continuously tests your APIs, applications, and critical user journeys from over 20 global locations, so you can detect and fix problems faster. To learn more, refer to the technical documentation.
Grafana Cloud is the easiest way to get started with metrics, logs, traces, dashboards, and more. We have a generous forever-free tier and plans for every use case. Sign up for free now!

