
How to use SQL to learn more about your Grafana usage
Wilfried Roset is an engineering manager who leads an SRE team, and he is also a Grafana Champion. Wilfried currently works at OVHcloud, where he focuses on prioritizing sustainability, resilience, and industrialization to guarantee customers satisfaction.
Grafana needs a database to store all its objects, such as users, dashboards, or even data sources. Each time a user creates a dashboard, it results in a new row created in the database. This database backs everything in Grafana, which makes it a gold mine of information.
In this blog I'll show you how to take advantage of all those insights. But first, let's take a quick look at how this all works.
Grafana exposes its objects via an HTTP API, which you can essentially think of as the public API. Upon API call, Grafana manipulates the objects in the database and applies its business logic to them. And you can think of SQL queries as the internal API of Grafana, since there's a direct connection between what is exposed via the HTTP API and the objects in the database.
Still not convinced? Here is an example.
Let's say you create a dashboard in Grafana via a POST /api/dashboards/db, as per the documentation. But what the documentation does not say is that the dashboard is stored in the table dashboard.This is also true when you create a data source via a POST /api/datasources — it will be stored in the table data_source.
This table is exactly what we will use. With access to this database and a basic SQL expertise you can learn a lot about how a Grafana instance is used. Let's have a quick look at a few examples.
Disclaimer:
- The blog post is written with the database of a Grafana instance running v10.1 backend by a PostgreSQL database. The SQL queries are subject to change.
- All of the information gathered via SQL queries are also accessible via Grafana's API.
- Users must refrain from modifying the database objects. This could lead to breaking your database immediately or in the next upgrade!
Organizations, users, dashboards, and data sources
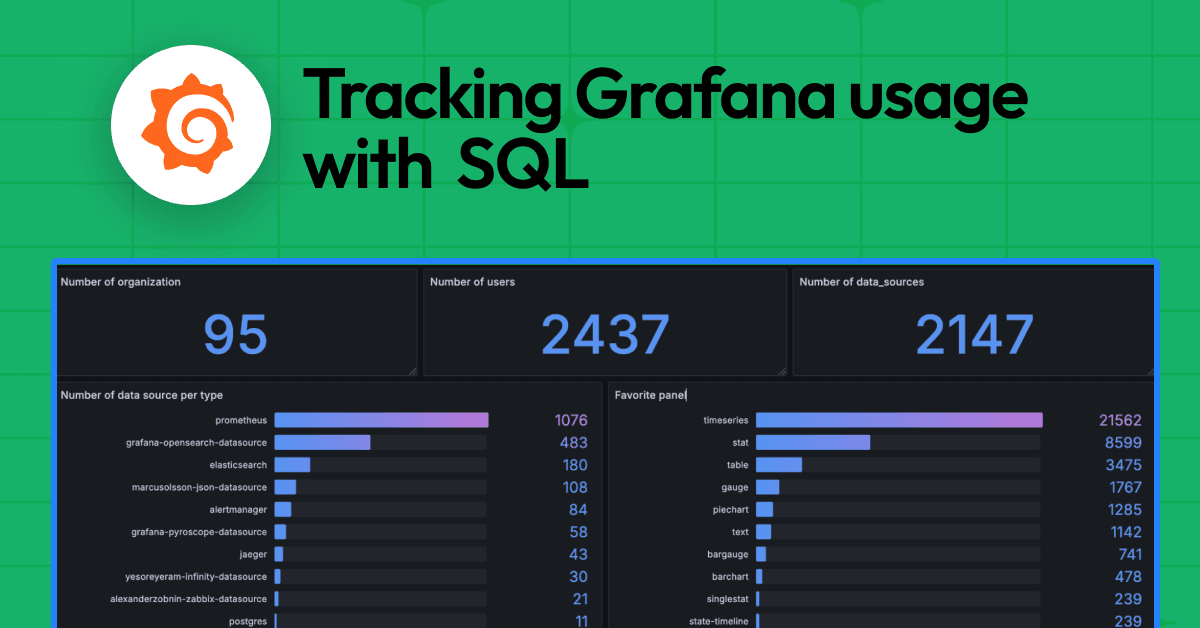
First, we're looking for general information such as number of users, dashboards, or data_source. (There is a pivot table in Grafana that makes the multi-tenant experience great.)
Grafana offers a nice way to organize yourself via organization. For example, your users might have access to an organization or your dashboards are visible in a given organization. Let’s start by looking at the number organizations, users, dashboards, and data sources in your instance:
The number of organizations
grafana=> select count(*) from org;
 count
-------
    95
(1 row)
The number of users
grafana=> select count(*) from "user";
 count
-------
  2165
(1 row)
Beware that double-quotes are mandatory because user is a reserved keyword in PostgreSQL. Without them your query returns the internal information in PostgreSQL rather than the content of the Grafana's table user.
The number of dashboards
grafana=> select count(*) from dashboard where is_folder= 'f';
 count
-------
  3684
(1 row)
The number of data_sources
sql
grafana=> select count(*) from data_source;
 count
-------
  1947
(1 row)
Digging deeper with SQL joins
Now that we have some general information, we can zoom in. This is doable with SQL joins in any way you like. We could, for example, try to identify the organization with the most users or, more specifically, the organization with the most users with Admin privileges.
The number of users per organization
grafana=> select org_id, count(*) from org_user group by org_id order by count desc limit 5;
 org_id | count
--------+-------
      1 |  2118
     94 |   424
     96 |   222
      2 |   202
    106 |   156
(5 rows)
The number of users with Admin privileges per organization
grafana=> select org_id, count(*) from org_user where role = 'Admin' group by org_id order by count desc limit 5;

 org_id | count

--------+-------

     96 |    30

     24 |    25

    537 |    23

    112 |    19

      4 |    16

(5 rows)
The list of all users with Admin privileges
grafana=> select distinct(u.login) from "user" u join org_user ou on u.id = ou.user_id where ou.role = 'Admin'  limit 10;
       login
-------------------
 Bulbasaur
 Ivysaur
 Venusaur
 Charmander
 Charmeleon
 Charizard
 Squirtle
 Wartortle
 Blastoise
 Caterpie
(10 rows)
Understanding user behavior
Now, let's dig a little deeper to better understand our users. For example, we might want to know the most used data_source type per organization.
grafana=> select type, count(*) from data_source group by type order by count desc limit 5;
             type              | count
-------------------------------+-------
 prometheus                    |   833
 grafana-opensearch-datasource |   349
 elasticsearch                 |   211
 opentsdb                      |   134
 marcusolsson-json-datasource  |    98
(5 rows)
With this information, we know how to better support our users by providing the appropriate training. However, we don't know which organization uses the most prometheus. This information is just a SQL query away.
grafana=> select org_id, count(*) from data_source where type = 'prometheus' group by org_id order by count desc limit 5;
 org_id | count
--------+-------
      1 |   206
    112 |    72
      4 |    57
    695 |    37
      2 |    31
(5 rows)
Great, we have the organization ID but this is not enough to know who to give training to. By joining the tables user, org_user, and org, we can have in a single statement:
- The organization ID
- The organization name
- The list of the users with
Adminprivileges within a given organization
grafana=> select o.id as org_id, o.name as org_name, array_agg(u.login) as admin from "user" u join org_user ou on u.id = ou.user_id join org o on o.id = ou.org_id where ou.role = 'Admin' group by o.name, ou.role, o.id  order by 1, 2 limit 3;
 org_id |             org_name              |                                                                                                                       admin
--------+-----------------------------------+----------------------------------------------------------------------------------------------------------------------------------------------------------------------------------------------------------------------------------------------------
      1 | Foo                               | {Bulbasaur,Charmander}
      2 | Bar                               | {Charmeleon,Squirtle,Blastoise}
     12 | Baz                               | {Venusaur}
(3 rows)
As you can see, you can learn a lot by exploring Grafana's database. There is still a lot more that can be done to understand how your Grafana instance is used, but the queries can become harder to write, read, and understand. Let's keep this for another time...
Or not. Here is OVHcloud’s most used panel type across our 3,000 dashboards.
grafana=> SELECT
  elements.value AS panel_type,
  COUNT(*) AS count
FROM
  dashboard,
  jsonb_array_elements_text(jsonb_path_query_array(data::jsonb, '$.panels[*].type ? (@ != "row")')) AS elements
GROUP BY
  elements.value
ORDER BY
  count DESC;
              panel_type               | count
---------------------------------------+-------
 timeseries                            | 16045
 stat                                  |  7007
 table                                 |  2630
 graph                                 |  1691
 gauge                                 |  1443
 singlestat                            |   972
 text                                  |   937
 piechart                              |   906
 bargauge                              |   603
 barchart                              |   311
 grafana-piechart-panel                |   197
 state-timeline                        |   135
 table-old                             |   132
 heatmap                               |   123
 dashlist                              |    76
 petrslavotinek-carpetplot-panel       |    55
 logs                                  |    43
 status-history                        |    42
 grafana-clock-panel                   |    37
 geomap                                |    26
 alertlist                             |    25
 netsage-sankey-panel                  |    24
 marcusolsson-treemap-panel            |    21
 histogram                             |    20
 grafana-polystat-panel                |    14
 knightss27-weathermap-panel           |     8
 grafana-worldmap-panel                |     6
 natel-discrete-panel                  |     5
 trend                                 |     4
 xychart                               |     4
 welcome                               |     3
 traces                                |     2
 jdbranham-diagram-panel               |     2
 flant-statusmap-panel                 |     2
 yesoreyeram-boomtable-panel           |     2
 alexanderzobnin-zabbix-triggers-panel |     1
 nodeGraph                             |     1
 canvas                                |     1
(38 rows)

Time: 1413.119 ms (00:01.413)

SQL is awesome, especially PostgreSQL with its powerful jsonb features. If you like challenges, you can try to produce the same information by using Grafana's API—with the same response time.
Want to share your Grafana story and dashboards with the community? Drop us a note at stories@grafana.com.

