New in Grafana Alerting: a faster, more scalable way to manage your alerts in Grafana
Effective alerting is the backbone of any observability strategy. But as your systems grow, managing hundreds or even thousands of rules can become a significant challenge. And when something goes wrong, the last thing you want is to fight with your tooling.
That’s why we’re thrilled to announce the launch of our brand new alert rules list page, which we built to provide a faster, more intuitive, and scalable experience for teams of all sizes!
This isn’t just a minor update; it’s a complete, ground-up redesign. We’ve listened to your feedback and focused on creating a workflow that helps you see what matters most, cutting through the noise and empowering you to take action.
In this post, we’ll explore the new features and show you how the redesign will make your on-call life a little bit easier. We’ll also dig into the challenges we faced in implementing these changes and the solutions we ultimately landed on to improve your Grafana Alerting experience.
Evolving Grafana Alerting: Identifying UX improvements
While the existing alert rule list has been a core part of the workflow for years, we identified several areas where we could make significant enhancements:
- Performance: For many of you managing large-scale deployments, this was a major bottleneck. The page could become sluggish and difficult to use when handling thousands of alert rules.
- Clarity: The user experience also felt cumbersome at times. The grouped view, which combined namespaces and group names, was often confusing. It was also hard to get a quick overview when you had to expand multiple collapsible sections just to find a search result.
- Usability: The page was simply trying to do too much. It was overloaded with information, which often distracted from its core purpose: to help you find and manage your alert rules quickly.
A tour of the new alert rules page: clarity and speed
Our primary goal was to create an experience that is focused, intuitive, and fast for all types of users—from those managing a small set of rules for a personal project to a large enterprise managing tens of thousands of rules across multiple teams.
Let’s walk through the key improvements.
Two views, two purposes: grouped and list
We’ve replaced the old, complex structure with two distinct views that serve clear purposes:
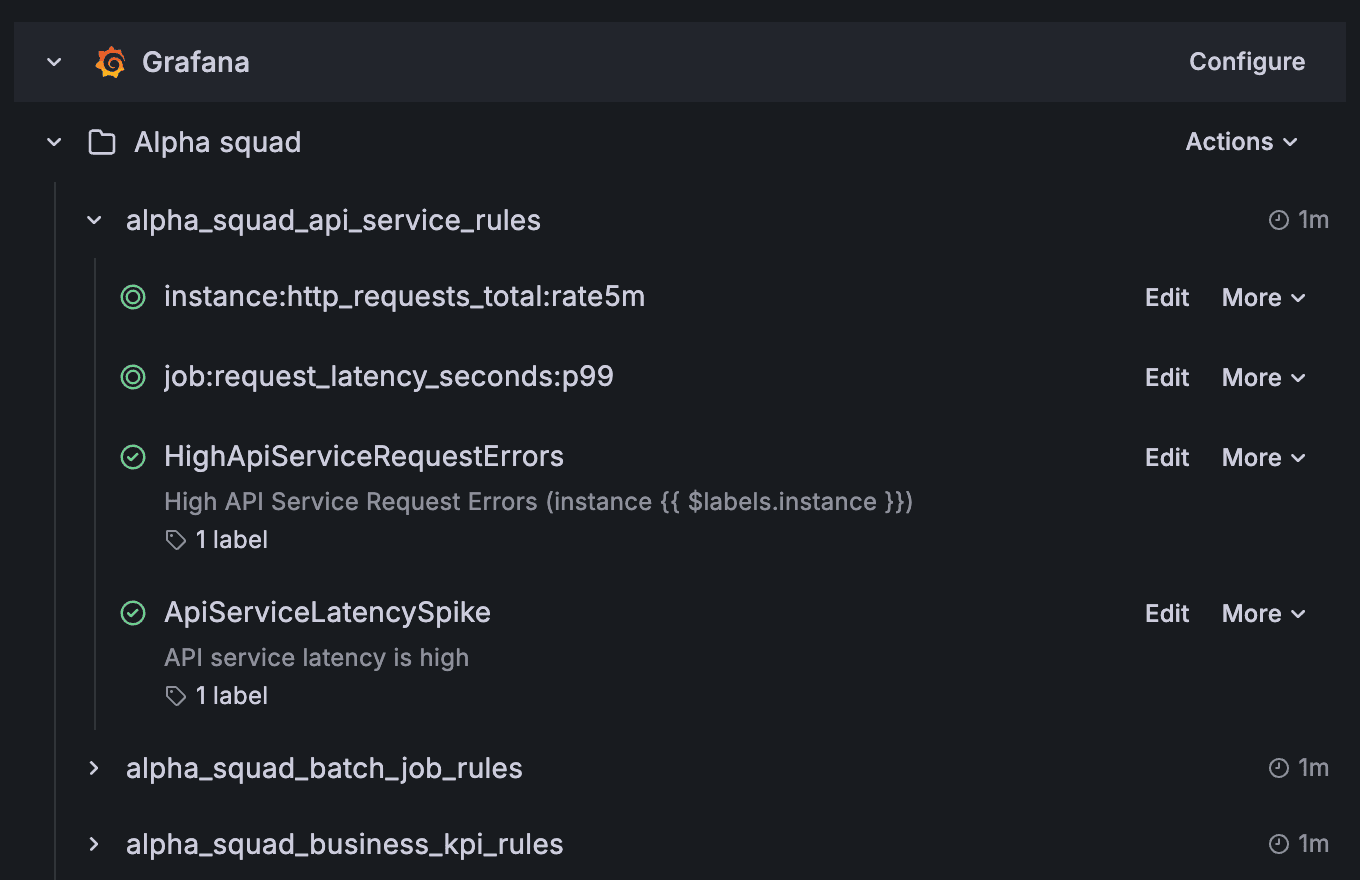
- Grouped view: If you need to understand the structure of your alerting setup or find rules within a specific team’s namespace, this is the view for you. The grouped view is designed to show you how your rules are organized. It provides a clear hierarchy, allowing you to drill down from namespaces to the specific groups you’re looking for.
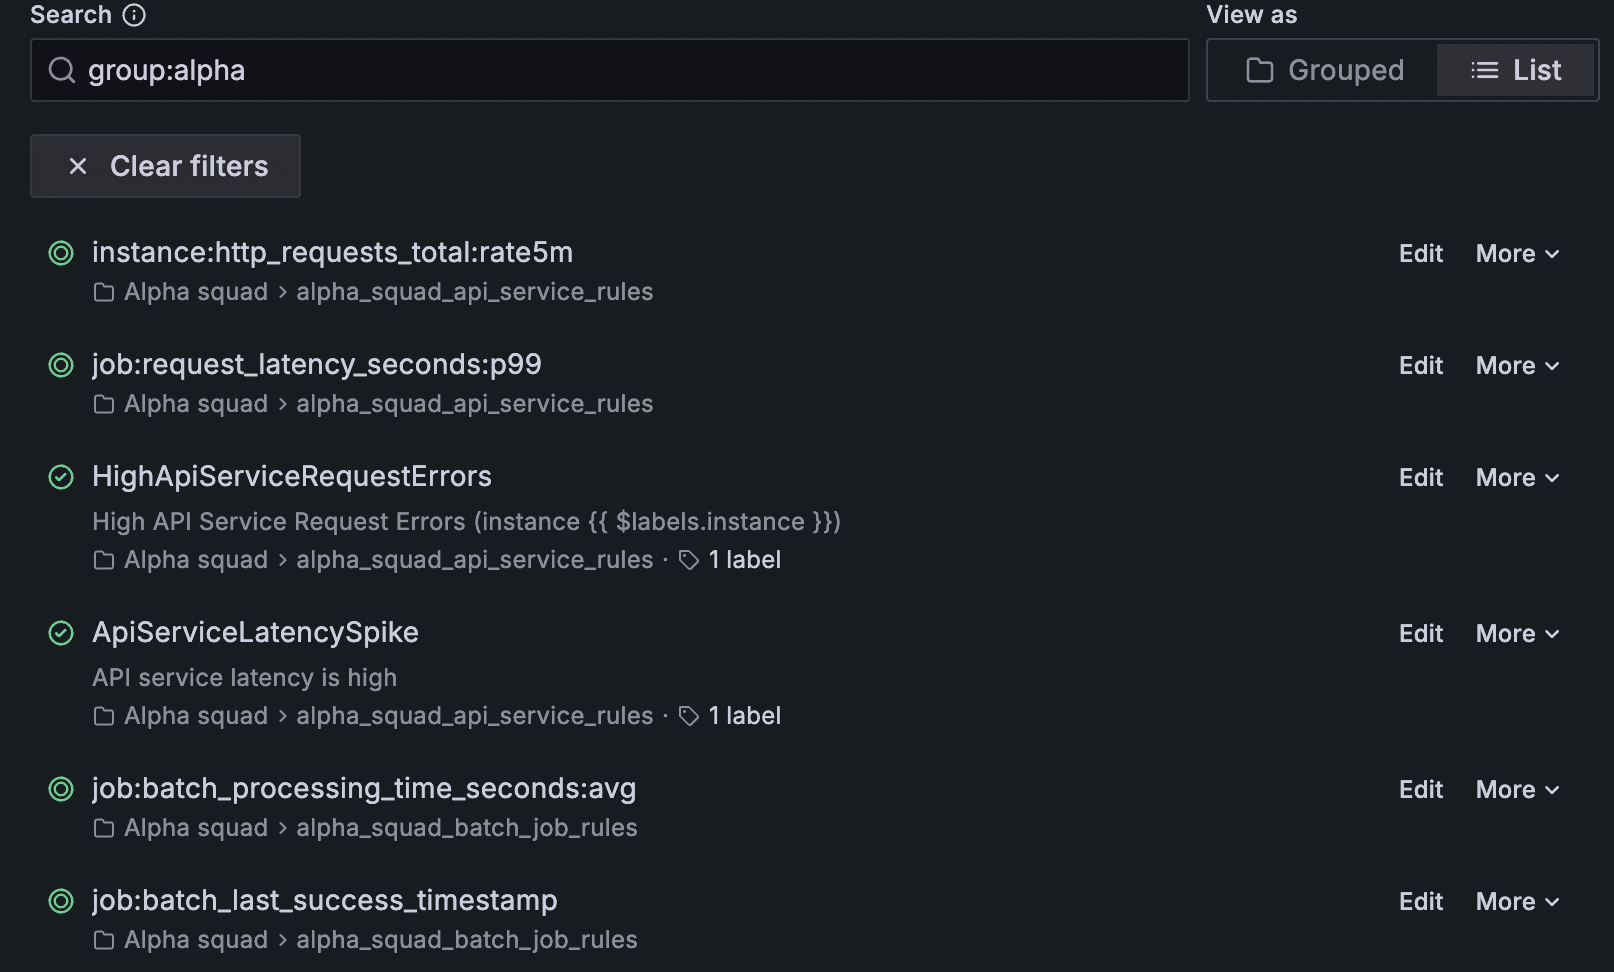
- List view: When you need to quickly search across all your rules, this is your new go-to. The list view is all about the rules themselves. It presents a flat list of all your alert rules, designed for quick searching and filtering. This view puts our filtering capabilities front and center, allowing you to instantly narrow down thousands of rules to find exactly what you need.
A cleaner, more focused UI
Finally, we’ve decluttered the interface to focus on the core task of managing your alert rules. We’ve created a cleaner, more streamlined view that surfaces only the most crucial details:
- Rule name
- Location (folder and group)
- Type (alerting or recording)
- State (for alerting rules, this will be alerting, normal, or pending)
The rule name is now a clickable link that takes you directly to the rule details page for a deeper look. For actions, we’ve simplified the UI to just two buttons: an Edit button that takes you to the edit form, and a More menu that gives you access to less frequent options. This new design makes it easier to assess your rules at a glance and take action without distraction.
A focus on performance
To address the performance issues of the old page, the new rules list is built on a brand-new, paginated API. This means that data is loaded in efficient chunks, providing a consistently fast and responsive experience. Whether you have a few hundred rules or several thousand, browsing and searching your alerts should now be a breeze.
How to get started with the new rules list
Ready to give it a try? Here’s how you can access the new and improved alert rules list:
For Grafana Cloud users: We are currently rolling out the new rules list page across all Grafana Cloud instances. You should see it in your account soon, with no action required on your end.
For Grafana OSS and Enterprise users: The new page is generally available starting in Grafana 12.1. It is currently accessible via a feature toggle. To enable it, find the feature_toggles section in your Grafana configuration file and add the alertingListViewV2 toggle:
[feature_toggles]
alertingListViewV2 = true
After restarting Grafana, you will see the new rules list page.
Please note that we plan to make this the default experience in a future Grafana release.
How we solved the performance puzzle
Building a more intuitive UI wasn’t always an intuitive process. Next, we’ll take a brief look at what we had to do behind the scenes to make it all work smoothly for you (Skip ahead to the next section if you’d want go straight to learning about the other UI improvements we have planned for Grafana Alerting.)
The challenge: Juggling speed and consistency
To present a complete picture of your rules, the Grafana Alerting UI needs to pull data from two primary sources. The State API is fast and was recently updated to support pagination, but it’s eventually consistent. This means changes made to rules could take a while to be reflected in the UI. On the other hand, the Config API is strongly consistent, showing changes immediately—but it suffers from performance issues at a large scale because it lacks pagination.
The old page prioritized data consistency by relying on the slower Config API, which led to poor performance for users with many rules. We knew that to build a truly great experience, we needed to take the best from both worlds.
The solution: A layered approach
The recent addition of pagination to the State API enabled us to build a new hybrid solution that layers data from both APIs to get the best of each.
The new list page first uses the fast, paginated Prometheus State API to fetch the overall structure of the rule groups. This provides the backbone of the list very quickly. Then, to ensure you’re always seeing the most recent information, the UI uses the Config API to enrich this view with the latest, strongly consistent rule data on top of that paginated structure.
This approach does have a trade-off: What happens if you create a rule in a new rule group? It will take some time for that new group to propagate to the State API. To handle this, the UI will immediately display your new rule and an indicator to let you know that changes are still in progress in the background. This propagation typically doesn’t take more than a few seconds, after which the view returns to its fully consistent state.
The quest for a stable identifier
Another significant challenge we had to solve was identifiers. A Prometheus rule cannot be uniquely identified other than by its position within its group, which is not stable. This poses a problem for UI features that require a stable reference, like providing a direct URL to a rule’s edit page.
To solve this, we create a stable “fingerprint” for each rule by generating a hash from its location (namespace, group, name) and its attributes (labels, annotations, and query). This introduced another complication, as the representation of a query can differ between the two APIs. The State API might apply formatting, while the Config API provides the exact, raw version from the database. A hash generated from the State API’s version of a rule might not match one from the Config API’s version.
The rule details and edit pages must show the most up-to-date information, which requires the strong consistency of the Config API. To ensure a link to a rule works correctly, the identifier in the URL must be generated from that same, strongly consistent data. Therefore, we also use the Config API to build these stable identifiers, guaranteeing that the hashed IDs are predictable and work correctly across the application.
Navigating frontend vs. backend filtering
The final piece of the performance puzzle was filtering. Both the State and Config APIs provide very limited filtering capabilities. This means that most of the work to filter rules by name, label, or status has to be done on the frontend.
This poses another interesting challenge when dealing with pagination. Since the filtering happens in the browser, our frontend pagination is not in sync with the backend API’s pagination. For example, to populate a single page of 20 search results in the UI, the frontend might need to query multiple pages from the backend API.
To manage this, the frontend requests pages from all Grafana Alerting-configured data sources, combines the responses, and filters them according to the search criteria. This allows the UI to display results as soon as they are available from any data source, effectively streaming the results and keeping the experience fast and fluid.
What’s next for Grafana Alerting? From management to troubleshooting
This new rules list is a huge step forward for managing your alerts, but we know that’s only half the story. Once an alert starts firing, the next critical task is to troubleshoot it.
That’s why our team’s next major endeavor is to build a better experience for triaging active alerts. We’re designing a whole new section in Grafana dedicated to helping you find, investigate, and understand your firing alerts when they happen. Our goal is to give you the context you need to resolve issues faster.
Stay tuned for more updates as we get closer to releasing these new capabilities!
A more powerful Grafana Alerting experience
Focusing on performance, providing two distinct views for different use cases, and decluttering the UI, we’ve created a much more efficient way for anyone to manage their alerting landscape.
Our team is incredibly excited to deliver this new experience to our community. We hope it helps you spend less time searching for your rules and more time building amazing dashboards and observability workflows.
Grafana Cloud is the easiest way to get started with metrics, logs, traces, dashboards, and more. We have a generous forever-free tier and plans for every use case.Sign up for free now!