

The next generation of Grafana Mimir: Inside Mimir’s redesigned architecture for increased reliability
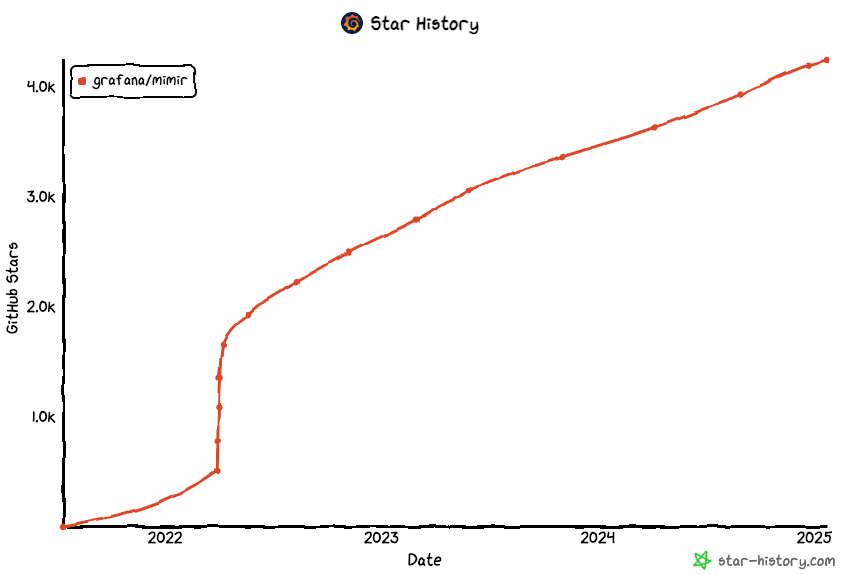
This year Grafana Mimir — the open source, horizontally scalable, multi-tenant time series database (TSDB) — will celebrate its third anniversary. Over the years, Mimir has become the go-to, Prometheus-compatible metrics backend within the open source community, with 29 maintainers and more than 4.6k GitHub stars.
Since introducing Mimir, we’ve worked hard to deliver on our promise of making it the most scalable and performant open source TSDB in the world. We’ve scaled Mimir to 1 billion active series (and beyond) and have taken steps over the years to improve availability, ensure ease of deployment, and offer super-fast query performance.
And while this year’s anniversary is a great time to pause and acknowledge how far we’ve come, it’s also an excellent opportunity to consider what’s next for Grafana Mimir. In this post, we’ll outline some of the architectural changes we’re making to Mimir and Grafana Cloud Metrics — the fully managed, highly scalable metrics service powered by Mimir — to make them more reliable so they can support future growth and new use cases at an even larger scale.
Mimir’s existing architecture
Before discussing what’s next, it’s helpful to understand a few things about Mimir’s current design.
In the existing architecture, ingester nodes are stateful and combine an in-memory TSDB with a durable, local write-ahead log (WAL) stored on persistent volumes. This design provides data durability in that every data point is replicated to three different persistent volumes. So in the case of a crash or failure, ingesters can recover all the previously acknowledged data by loading the most recent snapshot and replaying all the WAL entries from disk.
Every design has trade-offs, however, and we’ve come upon a few during conversations with users, as well as in our own experience operating Grafana Cloud Metrics:
- Because ingester nodes participate in both writes and reads, heavy queries can disrupt live writes.
- The ingester nodes are very stateful (due to the local WAL volumes they store) and must be managed with care.
Building out our new architecture for Mimir
To address both of the trade-offs described above, we made the core objective of our redesign to decouple the read and write paths. We wanted to ensure that an outage on the read path did not affect the write path, and vice versa, and decrease the complexity of managing the ingesters.
We landed on Apache Kafka, an open source distributed event streaming platform developed by the Apache Software Foundation, as the foundation for Mimir’s redesign because it is an open and growing standard with a thriving ecosystem.
When it came to Grafana Cloud Metrics, we had an additional design goal. We wanted to better serve customers with more stringent SLA requirements. To achieve this, we knew we had to run more of the service in multiple availability zones (AZs). Although this was already possible with Mimir’s existing architecture, the cross-availability zone data transfer charges it incurred made this cost-prohibitive to do on a large scale.
While Kafka allowed us to decouple the Mimir read and write paths, it didn’t solve this challenge of running cost-effectively across availability zones. This started us on a search for a different solution for Grafana Cloud Metrics.
Enter WarpStream
WarpStream caught our attention because it’s a Kafka-compatible data streaming platform built directly on top of object storage. It has no inter-AZ networking costs and no disks to manage, which means it could help us achieve all of our objectives for Grafana Cloud Metrics: cost-effective, multi-AZ deployments and decoupling our architecture so that the write path and read path are fully isolated. On top of the cost benefits, Warpstream is stateless and auto-scales. These bonus characteristics make Warpstream an even more attractive alternative to running open source Apache Kafka.
While it seemed WarpStream would help us hit our goals, we needed to ensure WarpStream could also support our scalability needs before settling on it. Given the size of Grafana Cloud Metrics, we knew it needed to handle read and write rates of tens of gigabytes per second.
So, our next step was to partner with the WarpStream team to run a load test. We wrote 1.5 GiB/s (compressed) through a single WarpStream cluster and consumed it with 4x fan-out for an aggregate compressed throughput of 7.5 GiB/s. We didn’t encounter any bottlenecks, demonstrating that WarpStream could meet our scaling needs.
We appreciated all the support we received from the WarpSteam team as we did all our testing, and look forward to our continued partnership with them.
What’s next
We’ve been hard at work developing and testing this new architecture, and we’re now gradually rolling it out to Grafana Cloud Metrics. While most users won’t notice any significant changes, under the hood their Cloud Metrics experience will be powered by a new version of Mimir that is dramatically more resilient to sudden spikes in query traffic and ingest volume.
Once these rollouts have finished and we’re confident that the new architecture has seen sufficient time in the wild, we’ll promote it to stable in Mimir OSS.
We expect to learn a lot during our rollouts to Grafana Cloud Metrics, so stay tuned as we share more details over the coming months!
Grafana Cloud is the easiest way to get started with metrics, logs, traces, dashboards, and more. We have a generous forever-free tier and plans for every use case.Sign up for free now!

