Metrics, logs, and literature: Inside The National Library of the Netherlands’ observability stack
Even in the digital age, you can’t deny the power of a good book. And at The National Library of the Netherlands, ensuring seamless access to those books is a top priority.
“Literature adds value to humanity,” said Gerard van Engelen, platform engineer for The National Library of the Netherlands, during a talk at GrafanaCON 2024. “We connect people around the world, but mainly in the Netherlands, by making Dutch literature available in a digital and physical way.”
Physically, the library houses a lot of books — so many, in fact, that the collection could span an impressive 120 kilometers if laid out back to back. But it also stores a lot of data to help eager readers digitally access those books and other literary resources via their website.
“We store 3.5 petabytes of digital literature, and it’s growing at 300-400 terabytes a year,” van Engelen explained. “We have literature dating back 406 years, and we make it available 24/7 on our site.”
To deliver on that goal — and ensure seamless and reliable access to their digital assets — the team turned to Grafana.
Want to tell your own story at GrafanaCON, our largest community conference of the year? We’re looking for speakers to share their real-world experiences with Grafana, custom-built plugins, cool dashboards, and more. This is a community-driven conference focused on your favorite visualization tool, its big tent of data source plugins, and the surrounding open source ecosystem — Prometheus, Loki, OpenTelemetry, Mimir, and more.
Authoring an observability strategy
The National Library of the Netherlands wanted to formalize their observability strategy for a few critical reasons. For starters, they prioritize the user experience, and wanted deeper insights into application performance.
“I think we all write software to solve a problem. And if the problem is not solved, the software is not working,” van Engelen said. “But if you don’t know that your software isn’t working, how can you act upon it?”

Next, as a government organization, they have strict requirements around log retention times. They wanted a platform that could provide centralized log storage, with clear and defined policies.
Lastly, the team wanted the ability to make decisions based on real-time data.
“In the case of the Dutch library, we are expanding our storage a lot,” van Engelen said. “We want to be able to plan for that upfront, and observability can help us with that.”
Why the Grafana stack for library stacks
The National Library of the Netherlands had previous experience with Splunk, but ultimately chose to implement Grafana to drive their observability strategy. Ease of use, according to van Engelen, was a big reason why, especially because the engineering team wanted to empower developers to build their own dashboards for data visualization.
“Once you get your infrastructure rolled out, the developer experience with Grafana is pretty easy, and I think most people that use Grafana already know this,” he said.
The second factor in choosing Grafana over Splunk was cost. “It meant a cost reduction of nearly 80,000 Euros a year, which is a nice one, in terms of OpEx,” van Engelen said.
Native Prometheus support was also a major factor in the decision to go with Grafana.
“In the end, we looked at all these attributes and came up with Grafana as being number one for us,” van Engelen told attendees.
Empowering developers and reducing MTTR
The National Library of the Netherlands deployed two Grafana servers on bare-metal VMs with a PostgreSQL database, as well as Grafana Mimir for metrics and Grafana Loki for logs, both running in monolithic mode.

For all applications that run on VMs in their landscape, they installed Grafana Agent, which scrapes the logs and then the Prometheus endpoints, and then sends those logs and metrics to Loki and Mimir. (Note: At GrafanaCON 2024, we introduced Grafana Alloy, our new open source telemetry collector that is 100% OTLP compatible and offers native pipelines for OpenTelemetry and Prometheus telemetry formats, supporting metrics, logs, traces, and profiles. Alloy uses the same components, code, and concepts that were first introduced in Grafana Agent Flow. Grafana Agent is now deprecated and is in Long-Term Support. To learn more, please refer to this blog post.)
The team also created their own Grafana Ansible collection to further simplify the developer experience.
“We templated this all out, and actually, the only thing that developers need to do when defining their infrastructure as code is to define a variable with an app name and a port number, and then they’re good to go,” van Engelen said. “Everything else is rolled out automatically.”
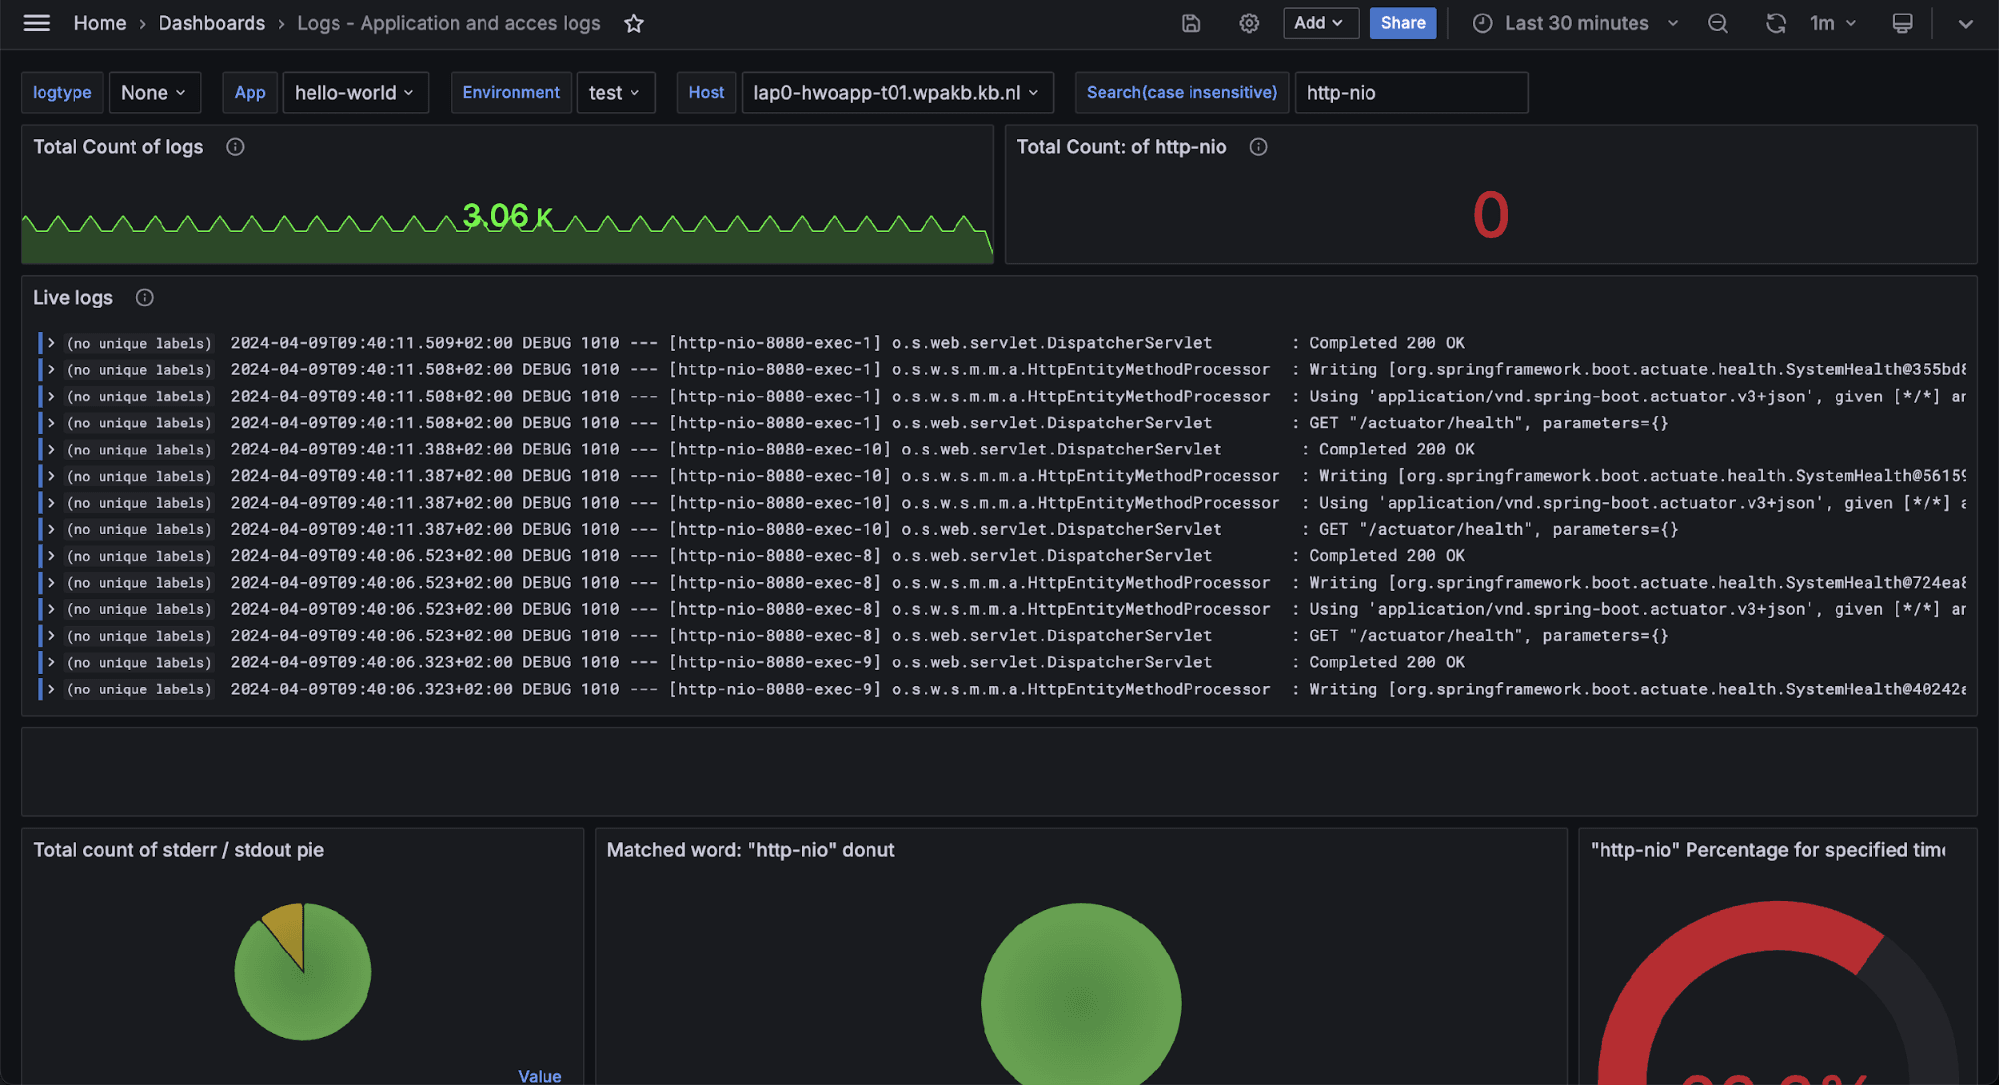
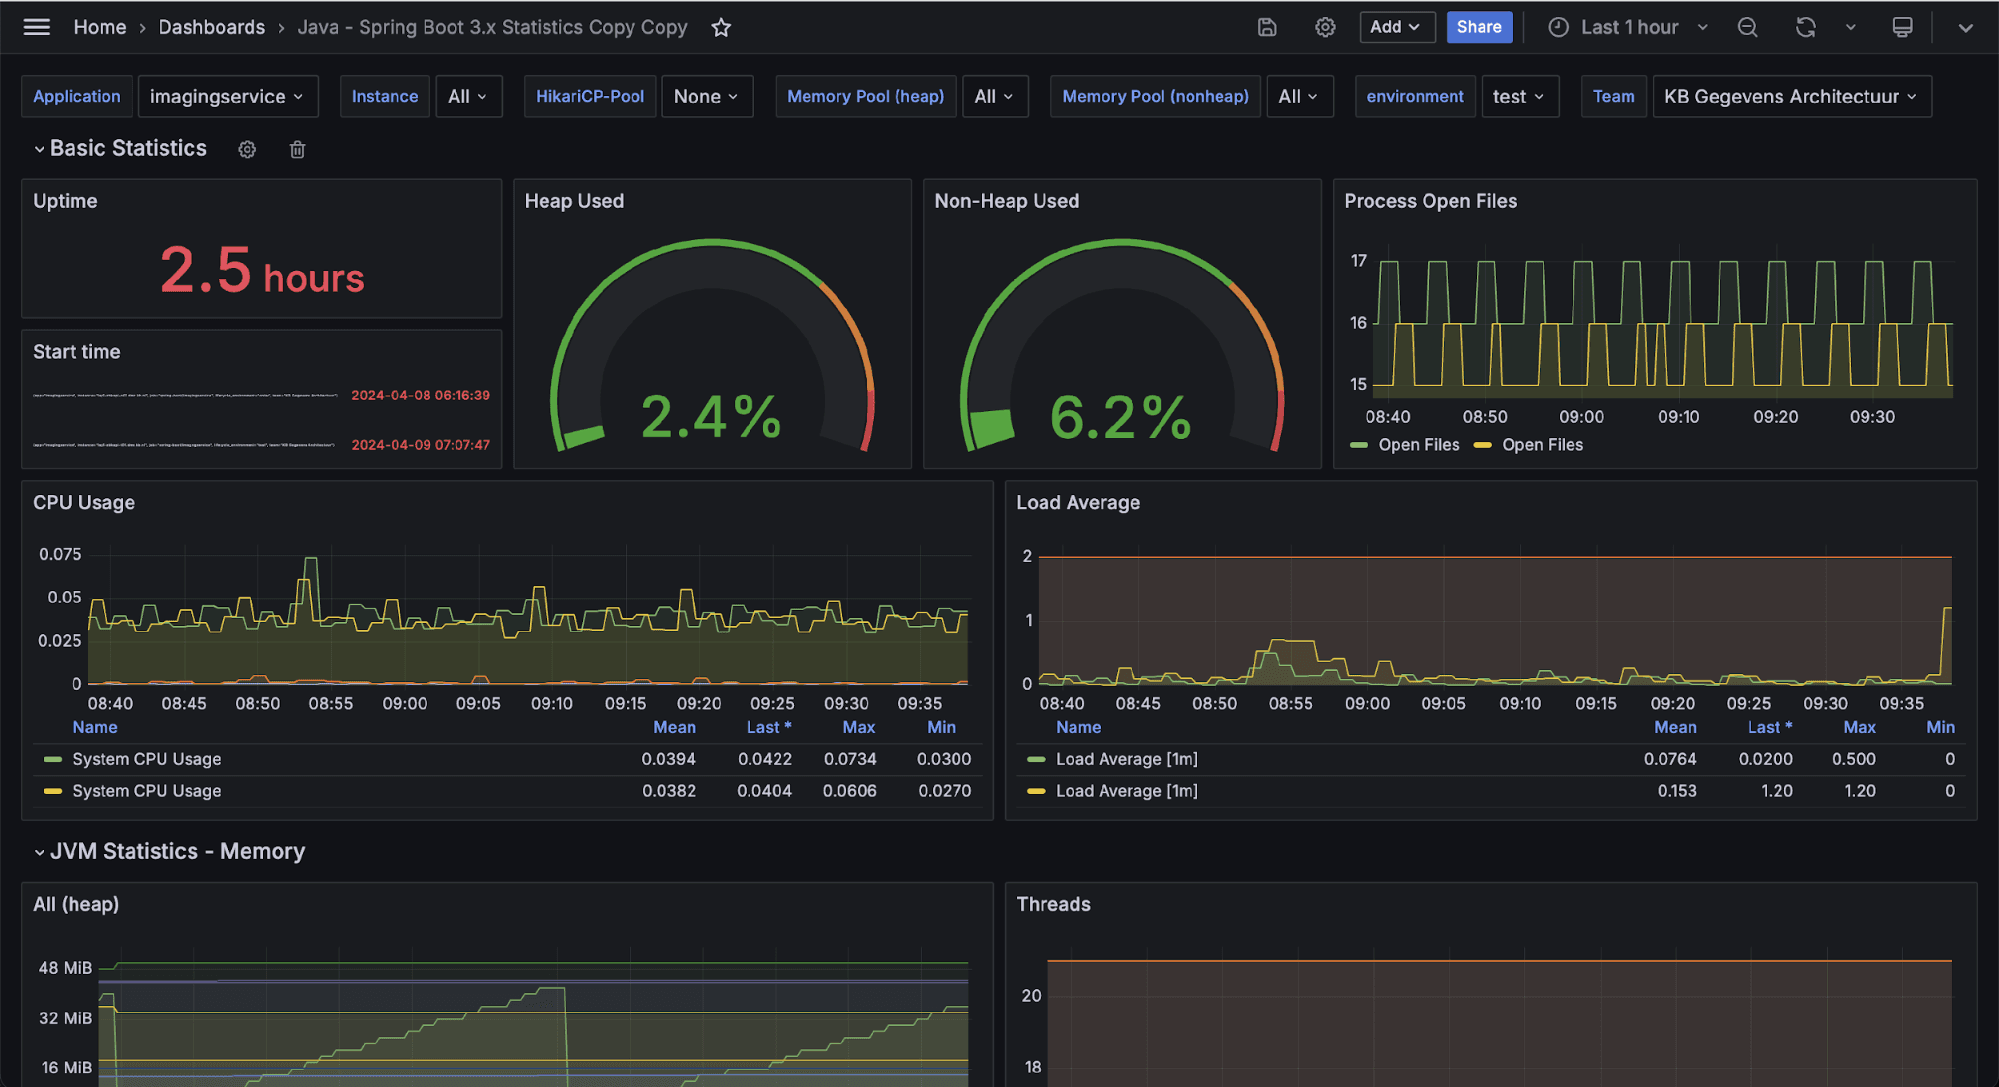
By visualizing application performance data in Grafana, the team is able to achieve what any librarian hopes for: a quiet environment where teams can debug issues and identify root causes faster.

“We can use these dashboards to really drill down into issues relatively quickly with a minimal amount of configuration,” van Engelen said.
What’s next
The National Library of the Netherlands has big plans to expand their use of the Grafana stack for their library stacks.
Looking ahead, for example, they’re going to implement Grafana Alerting to address performance issues more proactively, Grafana Tempo for distributed tracing, and Grafana Faro for real user monitoring and frontend app observability.
“Ths is is just the tip of the iceberg for us,” van Engelen said.
Grafana Cloudis the easiest way to get started with metrics, logs, traces, dashboards, and more. We have a generous forever-free tier and plans for every use case. Sign up for free now!


