
Grafana Labs Hackathon 2021: Meet Team Stonks ‘n Crypto
At the end of June, we held our first company-wide hackathon, and we were thrilled with the cross-functional creativity and team bonding that came out of it.
Team Stonks ’n Crypto took home the prize for best pitch and overall winner of the hackathon, receiving the most votes after the five finalist teams presented at a company all-hands meeting. Here’s a look at the team and their project.

The elevator pitch
Grafana is the de facto standard for time-series visualization and OSS observability. We are also expanding Grafana’s potential by better supporting use cases outside of the IT domain — for example, business intelligence (BI).
What potential BI-ish use case/business has a massive amount of time series data, where folks like to stare at time-series graphs all day (ideally up and to the right), where up-to-date information (live data!) is critical???
=> Yup, stocks and crypto trading by institutional and retail traders.
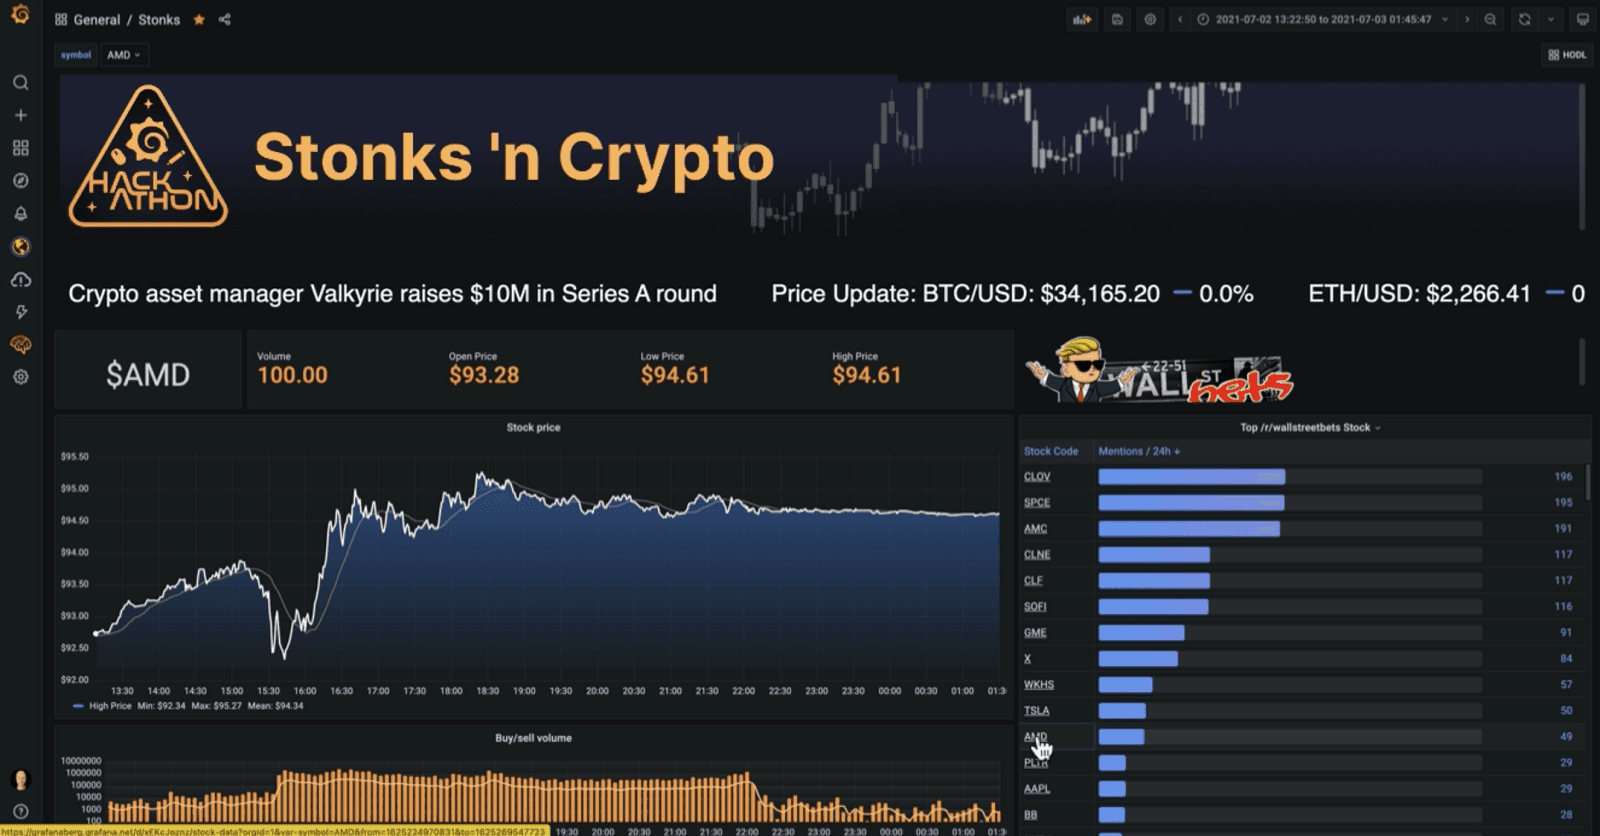
For this hackathon, we created a live stock/crypto monitoring platform. We combined the power of projects like Loki, Cortex, and Grafana that are underpinning Grafana Cloud.
The team members
Ward Bekker, Senior Principal Solutions Engineer
Willie Engelbrecht, Senior Solutions Engineer
Leon Sorokin, Senior Software Engineer
Yas Ekinci, Senior Software Engineer
Their hackathon experience
Where did the project idea come from?
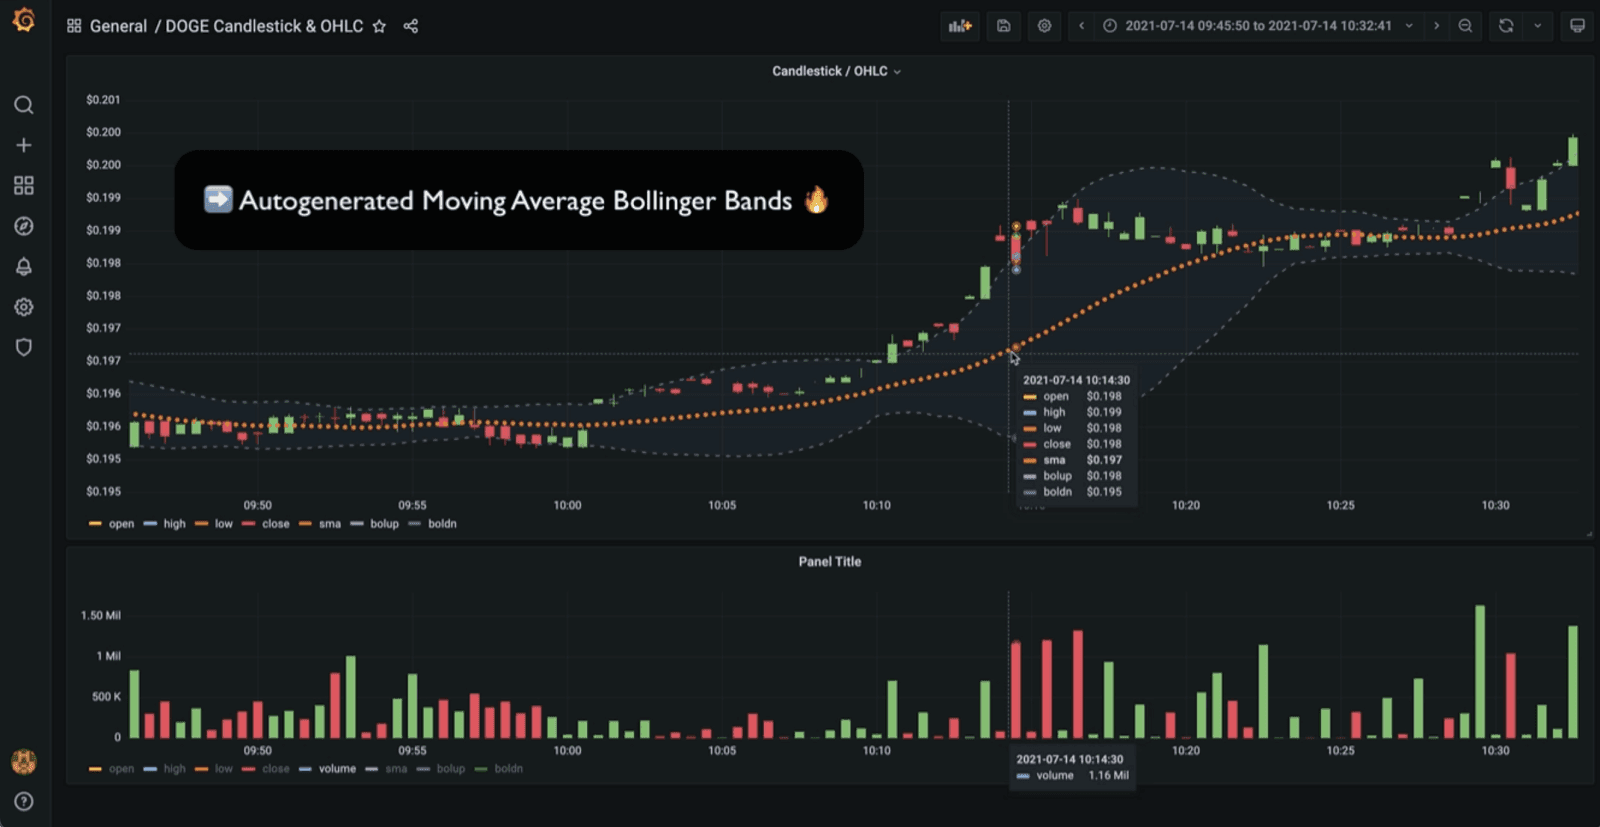
Ward: I was building a bare-bones algorithm trading and backtester system for crypto. I used Loki to ingest the training logs, and Grafana to visualize crypto market info and to correlate it with backtesting events and results. I noticed that there wasn’t a good plugin for Grafana to support OHLC visualizations. As market info is all time series data, and Grafana is the leading OSS project for visualizing time series data, I believed that the addition of OHLC would increase the potential for Grafana even further, beyond the IT observability space and into financial market observability.
Grafana v8 made the switch to a new time series panel based on uPlot, a javascript visualization library built by Leon Sorokin, who also happened to join Grafana Labs in October 2020. uPlot already had support for OHLC.
With the announcement of the hackathon, I found it a good opportunity to show off the huge potential Grafana has for financial market visualization and analyses in a compelling way.
I wrote a quick brief on my idea, posted it in the #hackathon Slack channel during the team formation period, DM-ed a few peeps, and was very fortunate that Leon, Willie, and Yas were crazy enough to join the team.
Had you done a hackathon before?
Ward: Only once, which happened to be an important turning point in my career as a Microsoft-focused developer. Between 2004 and 2007, I co-created a prototype Rapid Application Development (RAD) environment for ASP.net. At the same time there was a RAD contest in the Netherlands where multiple teams needed to develop a target CRUD-type application as fast as possible. Long story short, we got our asses kicked by a team using what was then a new Ruby framework called Ruby on Rails. Not long after the contest, I bought a Mac, learned RoR, and traded my .NET job in for a Ruby on Rails job in the center of Amsterdam.
Leon: Nope.
Willie: I’ve helped customers before with hackathons but have never participated in one as an employee.
Yas: Yes, but they were mostly 1-2 days. Typically used them to try out visualizations, e.g., so much 3D WebGL.
How did this team come together?
Leon: Torkel [Ödegaard] pinged me that Ward’s team might be interested in viz for financial use cases.
Willie: Ward messaged me asking if I would be interested in joining the team as I have played with crypto before and I also track my crypto using Grafana already.
Yas: I didn’t have a team yet, and was looking for an interesting project with time series data that we could apply machine learning on. Got in touch with Ward, and the rest was history.
Had you worked with each other before or met before?
Willie: Ward and I are in the same team (Solutions Engineering), and we often collaborate for our prospects and customers.
Yas: Nope. This was also part of why I joined this team.
Tell us about the division of labor. Did anyone have any surprising skills or expertise that they brought to the table?
Ward: I like to create informative videos on Grafana Labs projects, specifically Grafana Loki. (Shameless plug, check them out on the Grafana Labs YouTube channel.) So obviously we created a slick demo video for the pitch to get the maximum out of the five minutes of pitch time.
Leon: I hacked together a new OHLC/candlestick Grafana panel.
Willie: I used software to stream Twitter feeds and r/wsb data in real time to Loki.
Yas: I helped out with using Grafana Machine Learning for forecast, and tried out a new technique for anomaly detection (matrix profiles).
Any particularly memorable moments from the week?
Yas: One thing we wanted for the project was related to an old 3-digit Grafana issue from 2014, and Torkel/Leon got involved to get it over the line (actually released in 8.1 now).
What’s next for the project?
Ward: Make this a public accessible showcase. Work with financial market data providers to have Grafana data source plugins that work with their APIs (and support the new Grafana OHLC panel). Create a public GitHub repository that allows everyone to run and modify the showcase. It’s a great reference implementation.
Leon: We’re using the new Geomap and upcoming X/Y panel to iterate on how to map user-selected fields to pre-defined aspects of visualizations. This will allow us to move the prototype OHLC panel from a hacked-together implementation to a real one that uses the new field-to-vis mapping architecture. Aiming for a proper beta OHLC panel for Grafana 8.3.
Willie: Simplifying how we ingest the Twitter and r/wsb data, so that we can package it all in a Docker container for general consumption.
Yas: Adding the matrix profile bit to the Docker package. And probably it’s something we’ll make use of in our Grafana ML product.
What’s the best reaction you’ve gotten to the project?
Leon: “When can we ship it?”
Willie: Seeing [CEO Raj Dutt]’s eyes pop, but trying to keep it cool, when we presented for the first time.
What was the best part of the hackathon?
Ward: Seeing all the teams putting their best feet forward in the nerve-wracking pitch rounds. Really made me proud to be able to work with so much talent every day. And seeing our pitch resonating within Grafana Labs.
Leon: Seeing all the cool stuff the other teams were working on.
Willie: The amazing creativity of what some of the other teams were doing, solving problems I didn’t even know existed.
Yas: Really cool ideas, seeing so much get done in so little time. And meeting Grafanistas across the globe.
What’s the biggest thing you learned during the hackathon?
Ward: Trusting the team. Was great to see everybody executing on their part of the project that matched their expertise. At the start I was unsure how this would all come together at the right time. Turns out working with incredibly talented and highly motivated people and with a clear dot on the horizon makes this team process a no-brainer.
Leon: Ward is very good at pitching! Billy Mays would be proud.
Willie: Having a solid foundation as the core idea, but allowing people to innovate around it with their own skills.
Yas: +1 Ward x pitching master. :) And how people will come up with creative solutions if they get the space/time to do it.
Grafana Labs is hiring! We’re a fully remote team spread across the globe, in 40+ countries on 6 continents. Check out our job openings here.

