New in Grafana 8.1: Gradient mode for Time series visualizations and dynamic panel configuration
Grafana 8 brought with it many exciting new features, including the launch of a new alerting system and the expansion of Grafana’s live and streaming data functionality.
We didn’t stop there. In Grafana 8.1, alongside new additions like the Geomap and Annotations panel, we introduced some new features to the Time series panel as well as two transformations to help make panel configuration more dynamic.
Gradient mode for Time series panels
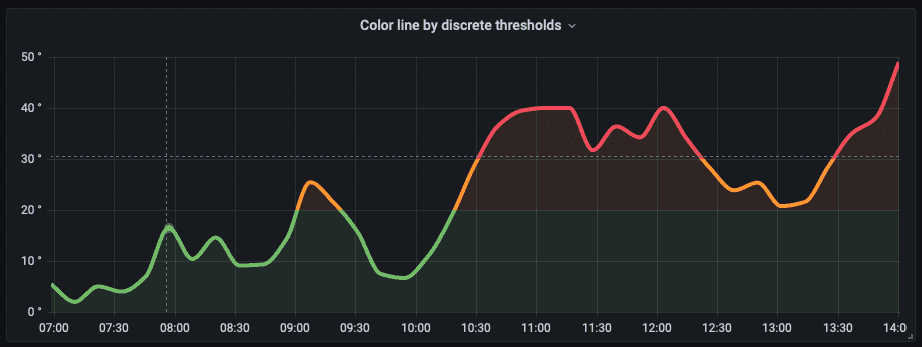
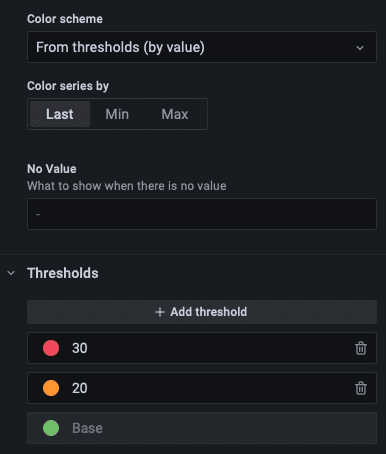
Starting with the Time series panel, we’ve added a new graph style option called Gradient mode. This option enables you to color a line or bar by using the values set in the Thresholds settings or a predefined color scale. As your data crosses the defined threshold(s), the color of the line will change to match.
Here’s a line chart with the Gradient mode color scheme set to color the lines using the discrete threshold values.


This next example is of the same series using the color scale option for the panel’s color scheme.

Being able to use color scales and colored thresholds directly on the lines or bars in the Time series panel can provide a more direct visualization of data against specific thresholds.
Configuring panels from queries
We’ve also added a new transformation that makes configuring panels from queries a reality. Using the new Config from Query Results transform, you can define a query that can then be used to derive standard panel configuration options. You can select panel config options like Min, Max, Thresholds, and more. You can then apply these results to other queries.
This powerful new transformation, alongside the new Rows to fields transformation, can help you build dynamic, query-driven configurations for your visualizations.
Please see our documentation (linked above) for more information on how to leverage these transformations. And don’t forget to join us on our community forums and community Slack if you have questions or simply want to share how you’re using these new tools!
You can get started with Grafana in minutes with Grafana Cloud. We have free and paid Grafana Cloud plans to suit every use case — sign up for free now.


