
VIDEO: Watch this first-look demo of the new Grafana Enterprise Logs
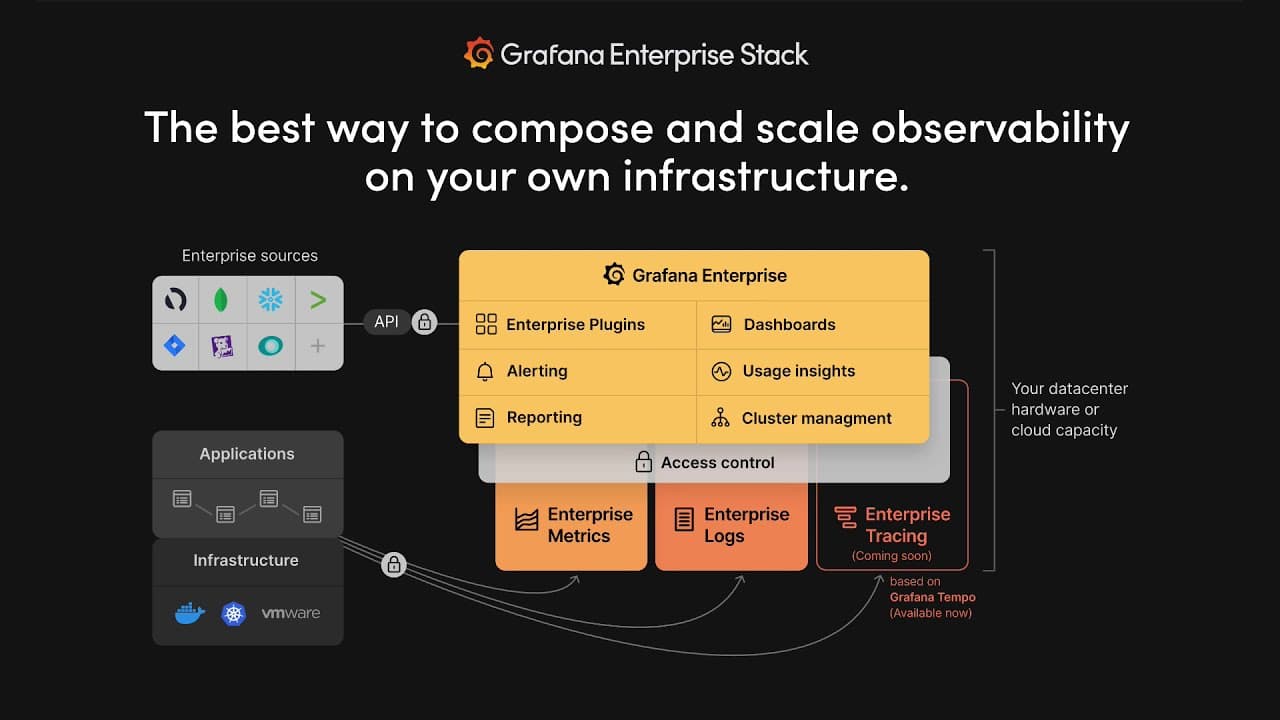
We recently announced Grafana Enterprise Logs, our latest addition to the Grafana Enterprise Stack, which is tailored for large organizations to compose and scale observability on their own infrastructure.
Powered by the Grafana Loki open source project for cloud native log aggregation, and built by the maintainers of the project, Grafana Enterprise Logs offers a unique approach to log indexing, storage, and administration control that allows companies to run it securely at scale.
I’ve put together this quick demo to show how easy it is to create and use new instances and access policies for your teams with the Grafana Enterprise Logs management interface.
I hope you enjoyed this first look at Grafana Enterprise Logs. For a deeper dive, be sure to register for the March 18 webinar, “Grafana Enterprise Logs: Logging with security and scale.” You can also read more about Grafana Enterprise Logs in the docs, and contact us if you’d like to try it out!

