How we live-migrated massive Cortex clusters to blocks storage with zero impact to Grafana Cloud customersGrafana CloudMimirPrometheusMigration
How to get started quickly with the new synthetic monitoring feature in Grafana CloudGrafana CloudGrafanaWorldPingSynthetic monitoring
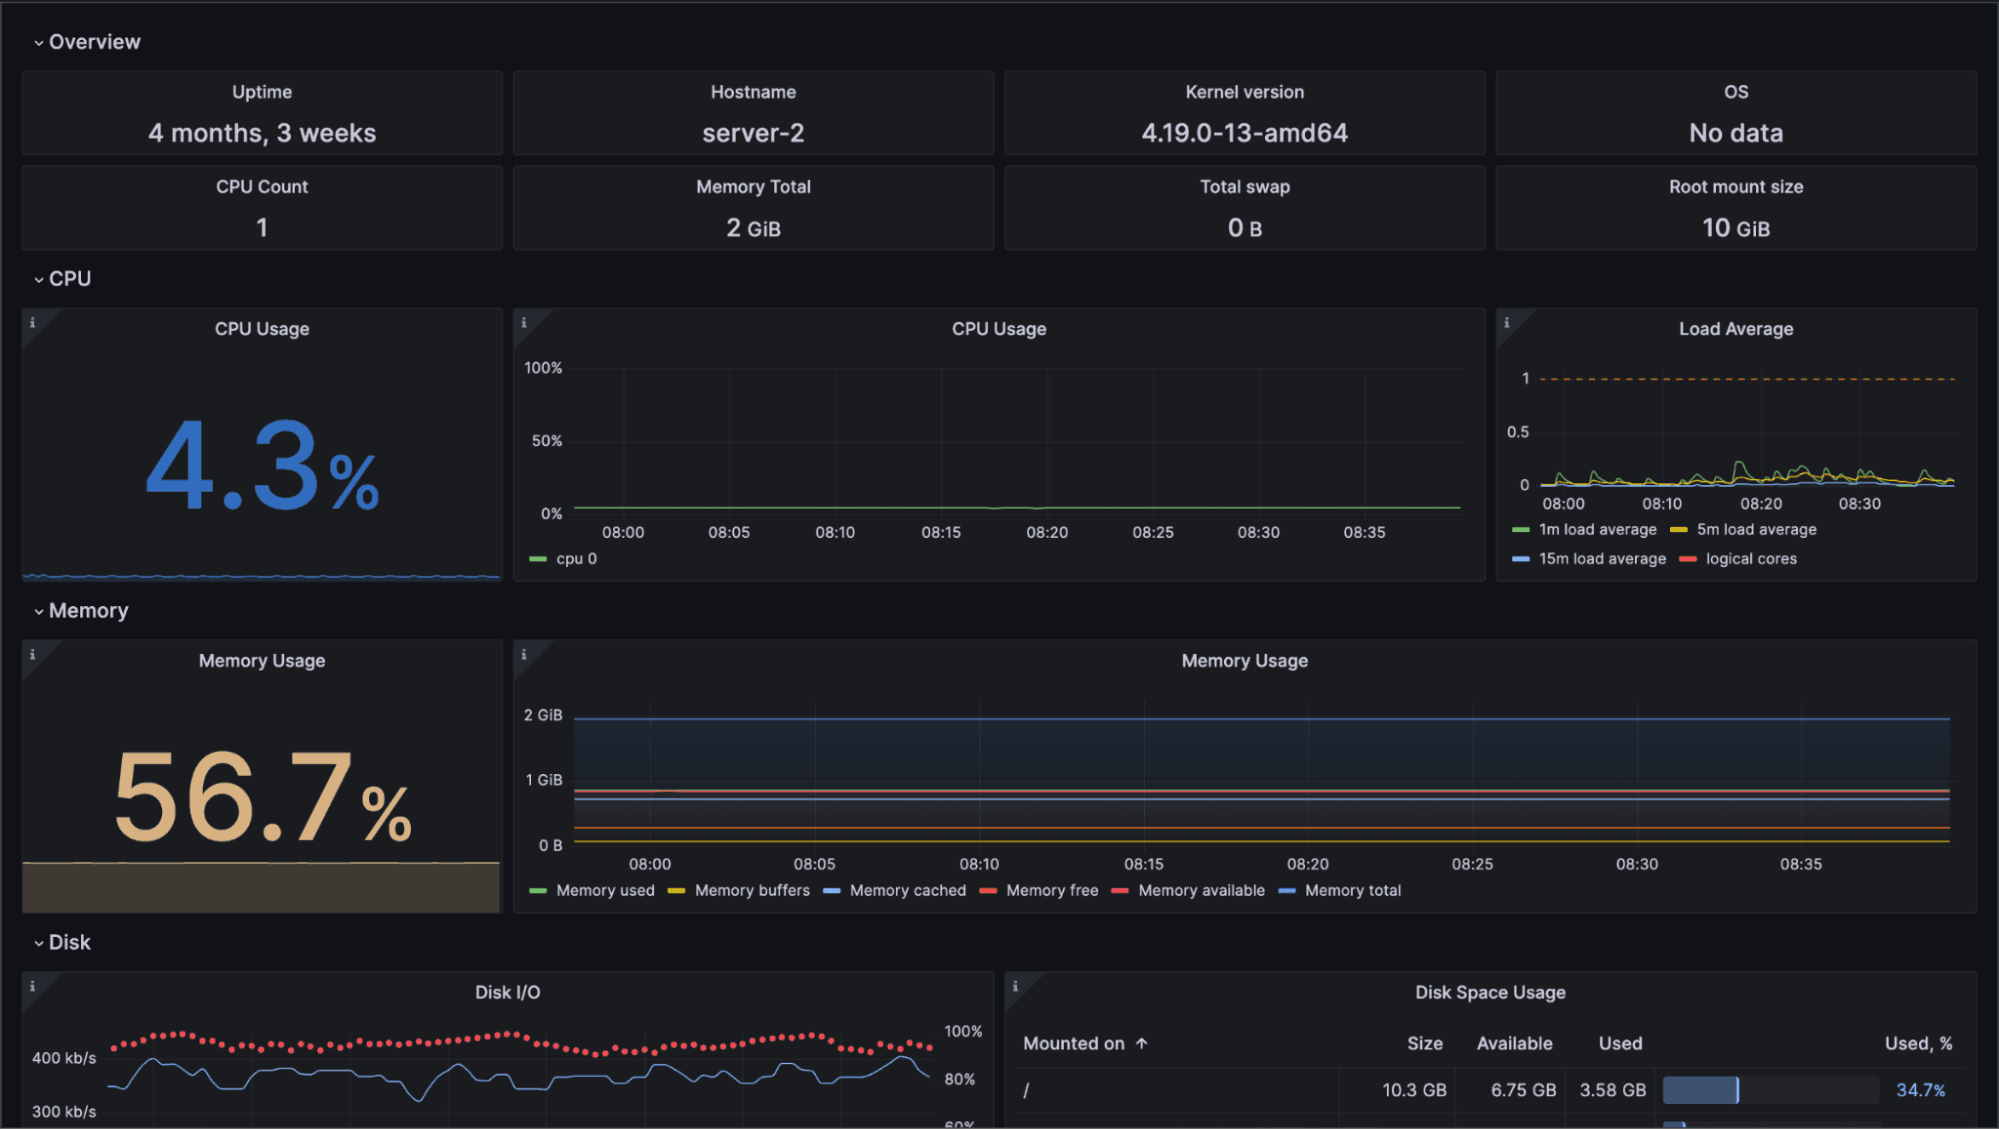
How to connect and monitor your Raspberry Pi with Grafana CloudGrafana CloudGrafanaMonitoringRaspberry pi
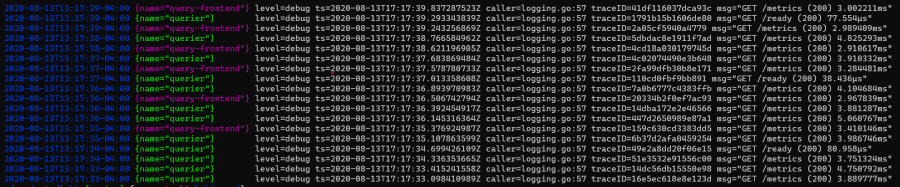
A beginner’s guide to distributed tracing and how it can increase an application’s performanceTracingTempoJaegerGrafanaObservability
How Prometheus monitoring mixins can make effective observability strategies accessible to allGrafanaObservabilityPrometheus
How to get started quickly with metrics, logs, and traces using Grafana Cloud integrationsGrafana CloudGrafanaPrometheus
The new Grafana Cloud: the only composable observability stack for metrics, logs, and traces, now with free and paid plans to suit every use caseGrafana CloudGrafanaLokiObservabilityPrometheusTempo
How using Grafana (and plugins) gave a jolt to Smart State Technology, a company advancing technology for energy infrastructuresGrafana
Cost attribution in Grafana Cloud: Manage spend across observability and testing workflows Grafana CloudCost managementSynthetic monitoringPerformance Testing
Stop switching tools to find answers: Grafana Assistant now works across 30+ data sourcesAIGrafanaIntegrations
'Grafana's Big Tent' podcast: Anthropic on agentic coding, observability, and the future of software engineeringPodcastsAIObservability
Explore what's next in agentic operations: Introducing AI WeekWe're excited to show you what's new in AI for observability and observability for AI—and for you to get hands on with all the latest AI tools during our first ever AI Week.AI
Grafana Labs named a Leader again in the 2026 Gartner® Magic Quadrant™ for Observability PlatformsObservabilityGrafana Cloud
Grafana 13.1 release: observability as code updates, extending Grafana Assistant across more data sources, and moreGrafanaRelease