Troubleshoot problems using GitLab activity data with the new plugin for GrafanaGrafanaPluginsGrafana EnterpriseGitLabGrafana Cloud
VIDEO: Watch this first-look demo of the new Grafana Enterprise LogsGrafana Enterprise LogsLoggingLoki
The new Splunk Infrastructure Monitoring plugin brings the SaaS formerly known as SignalFx to your Grafana dashboardsGrafana EnterprisePluginsDashboardKubernetesSplunk
What I’ve learned managing engineers — and my own work-life balance — during the pandemicTeamEngineering
The 3 major benefits that Grafana Cloud customers get from our hosted Prometheus serviceGrafana CloudPrometheusMimir
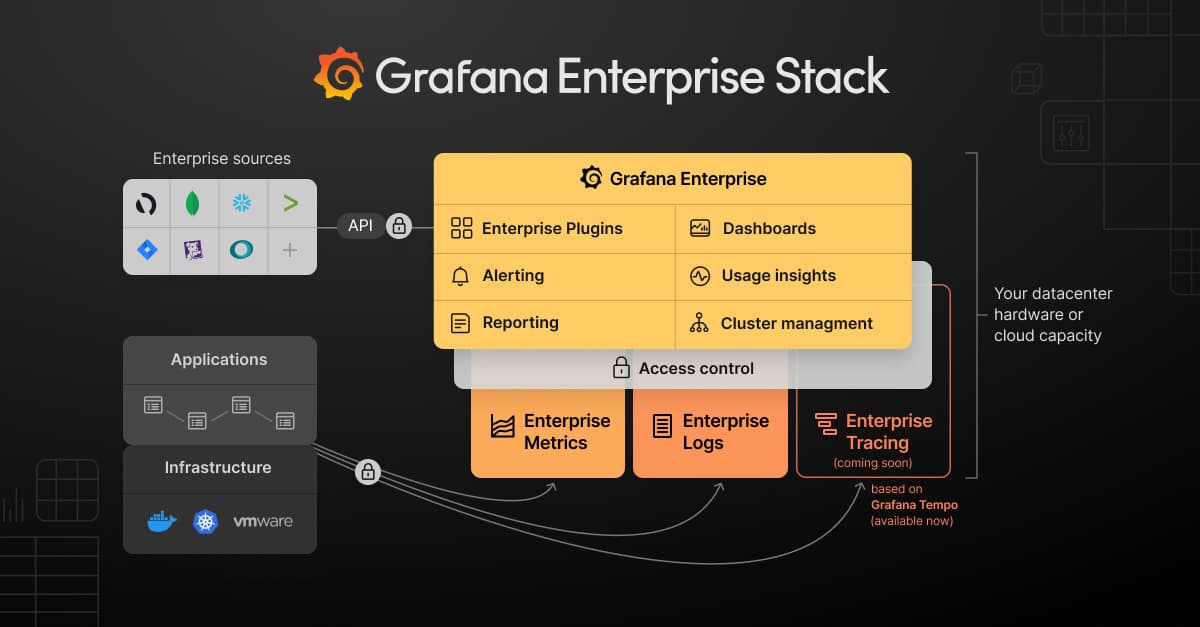
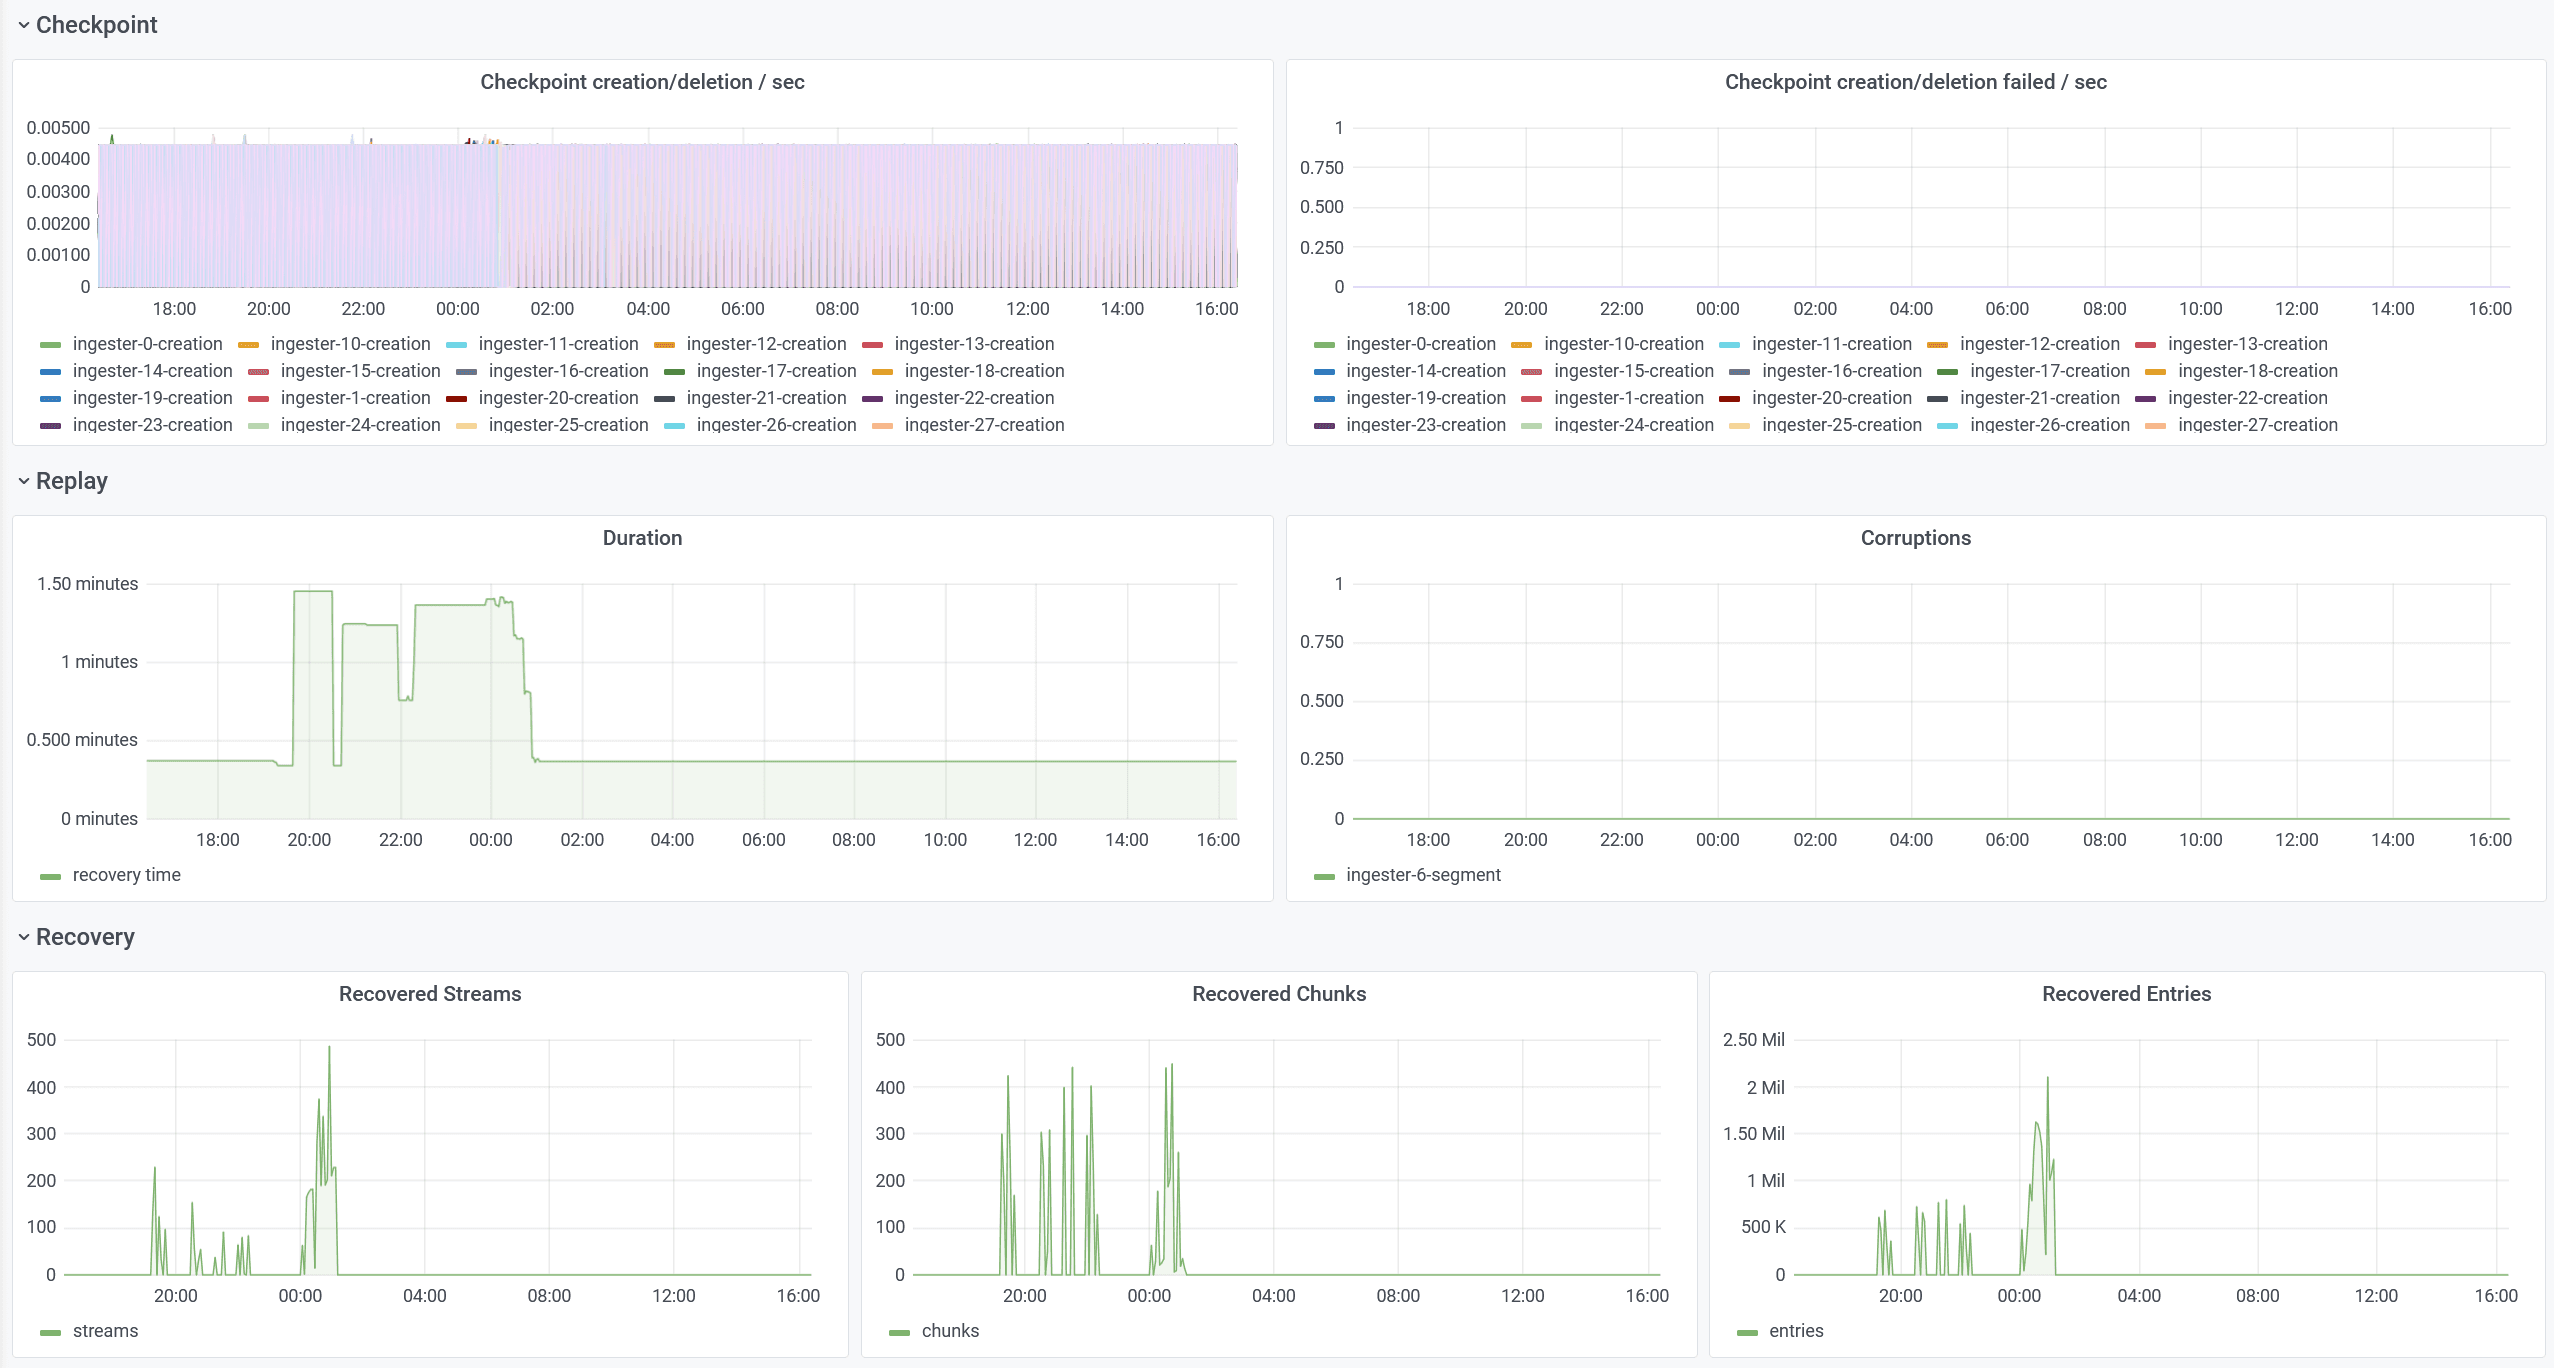
Introducing Grafana Enterprise Logs, a core part of the Grafana Enterprise Stack integrated observability solutionLokiLoggingObservabilityGrafana Enterprise Logs
How the new time series panel brings major performance improvements and new visualization features to Grafana 7.4Grafana
The Splunk plugin for Grafana now supports data links for jumping directly from logs to tracesGrafana EnterprisePluginsTempoJaegerTracingLogging
How the FourthDown NFL play-by-play API measures its performance with Prometheus, Jaeger, and Grafana CloudGrafana CloudGrafanaPrometheusJaegerMonitoring
Grafana 7.4 released: Next-generation graph panel with 30 fps live streaming, Prometheus exemplar support, trace to logs, and moreGrafanaPrometheusTracingLogging
Auto-instrumenting a Java Spring Boot application for traces and logs using OpenTelemetry and Grafana TempoTempoOpenTelemetry
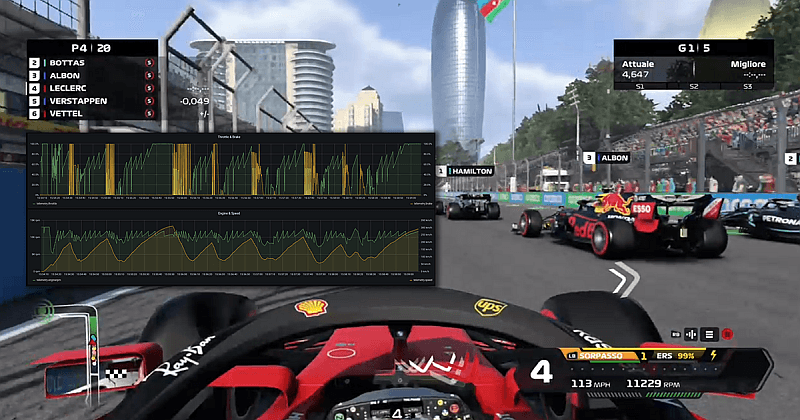
Real-time monitoring of Formula 1 telemetry data on Kubernetes with Grafana, Apache Kafka, and StrimziGrafanaMonitoringKubernetesKafka
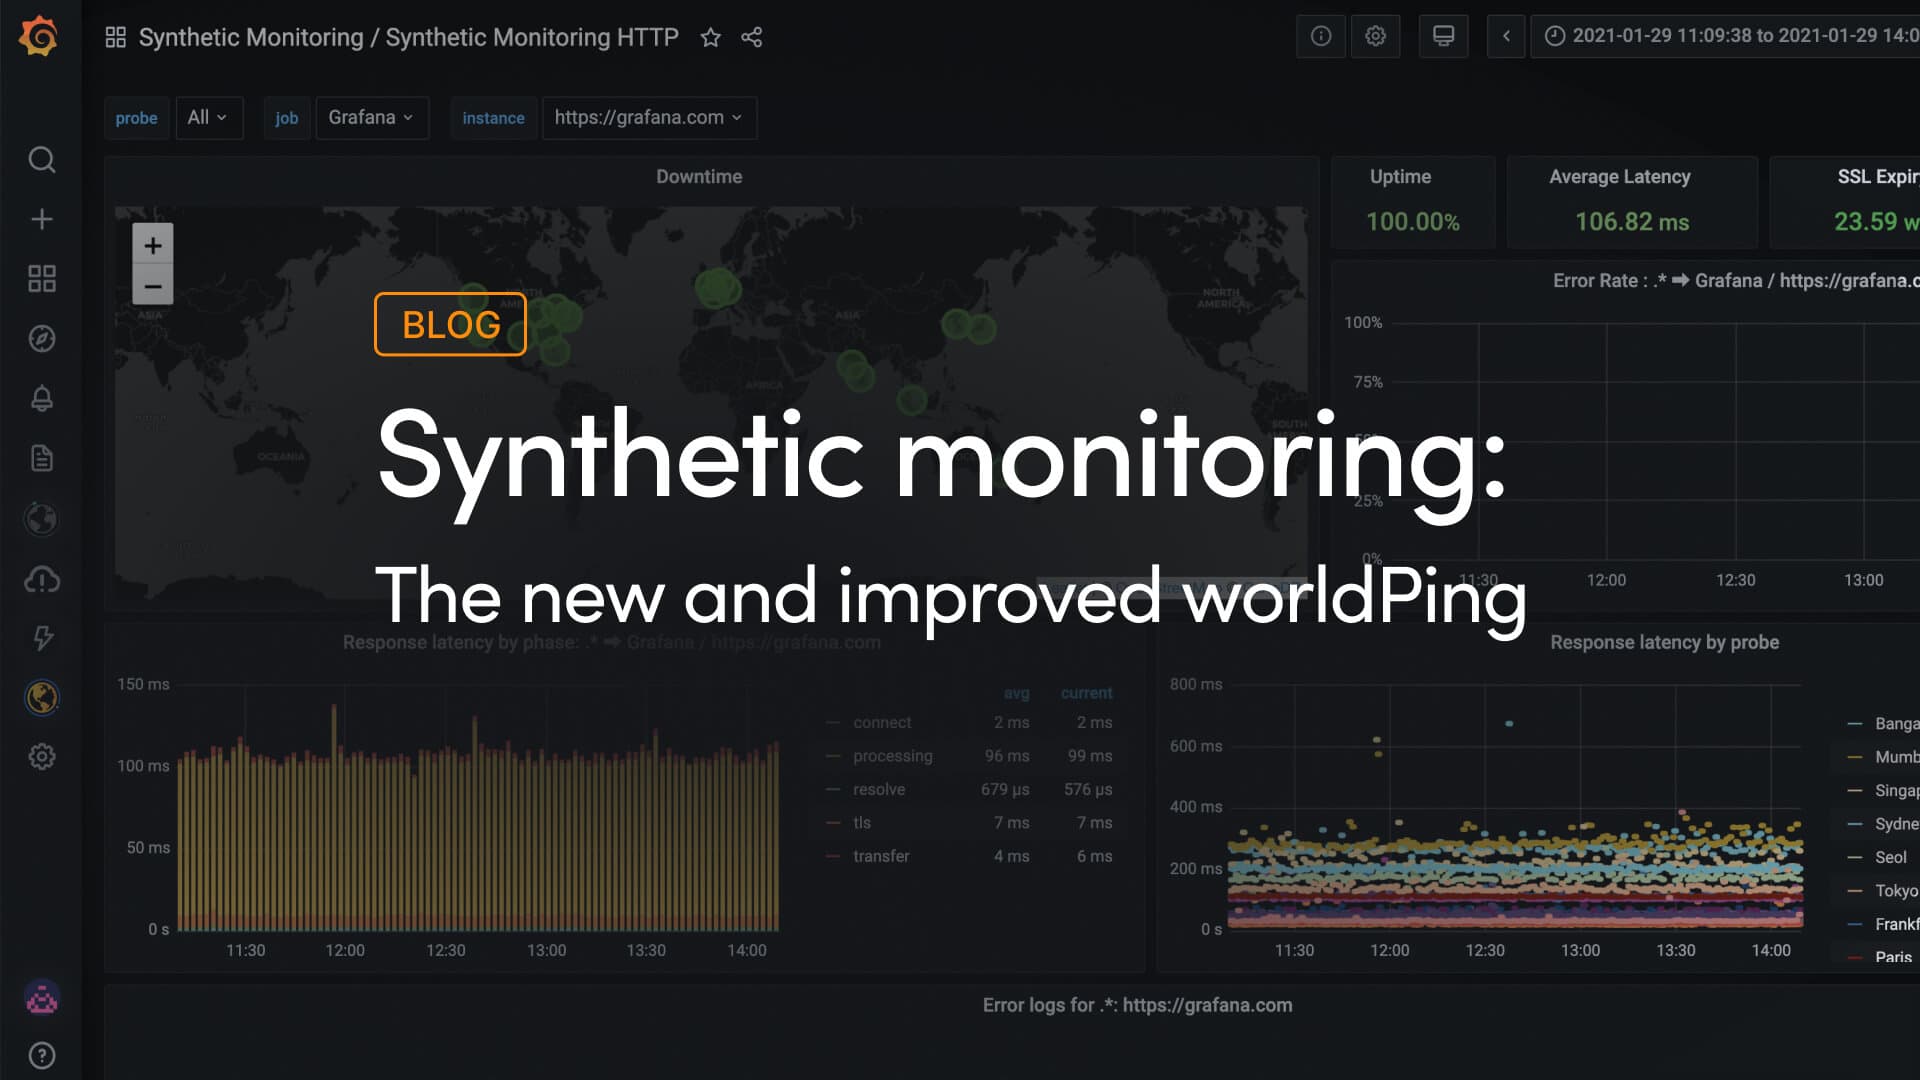
Farewell, worldPing. Hello, Grafana Cloud synthetic monitoring!Grafana CloudWorldPingSynthetic monitoring
Cost attribution in Grafana Cloud: Manage spend across observability and testing workflows Grafana CloudCost managementSynthetic monitoringPerformance Testing
Stop switching tools to find answers: Grafana Assistant now works across 30+ data sourcesAIGrafanaIntegrations
'Grafana's Big Tent' podcast: Anthropic on agentic coding, observability, and the future of software engineeringPodcastsAIObservability
Explore what's next in agentic operations: Introducing AI WeekWe're excited to show you what's new in AI for observability and observability for AI—and for you to get hands on with all the latest AI tools during our first ever AI Week.AI
Grafana Labs named a Leader again in the 2026 Gartner® Magic Quadrant™ for Observability PlatformsObservabilityGrafana Cloud
Grafana 13.1 release: observability as code updates, extending Grafana Assistant across more data sources, and moreGrafanaRelease