Grafana 7.5 released: Loki alerting and label browser for logs, next-generation pie chart, and more!GrafanaLokiTempo
What’s new in Grafana Cloud for March 2021: improvements to alerting, synthetic monitoring, and moreGrafana CloudGrafana AgentAlertingSynthetic monitoring
Meet the Grafana Labs team: Software engineer Vicky Lee, who builds Enterprise plugins for GrafanaTeamGrafana EnterprisePlugins
Grafana 6.7.6, 7.3.10, and 7.4.5 released with important security fixes for Grafana EnterpriseGrafanaGrafana Enterprise
Why implementing Grafana Enterprise was a bright idea for U.K. energy supplier UtilitaGrafana EnterprisePluginsOracle
What’s new in Grafana Enterprise Metrics for scaling Prometheus: enhanced access control and a compactor that supports 650 million active series and beyondPrometheusMimirGrafana Enterprise Metrics
Meet the Grafana Labs team: Uche Obasi, a software engineer who builds frontend Grafana featuresTeamGrafana
Grafana Loki 2.2 released: Multi-line logs, crash resiliency, and performance improvementsLokiLogging
A closer look at the admin API and plugin for centralized tenant administration and control in Grafana Enterprise LogsLoggingLokiGrafana Enterprise Logs
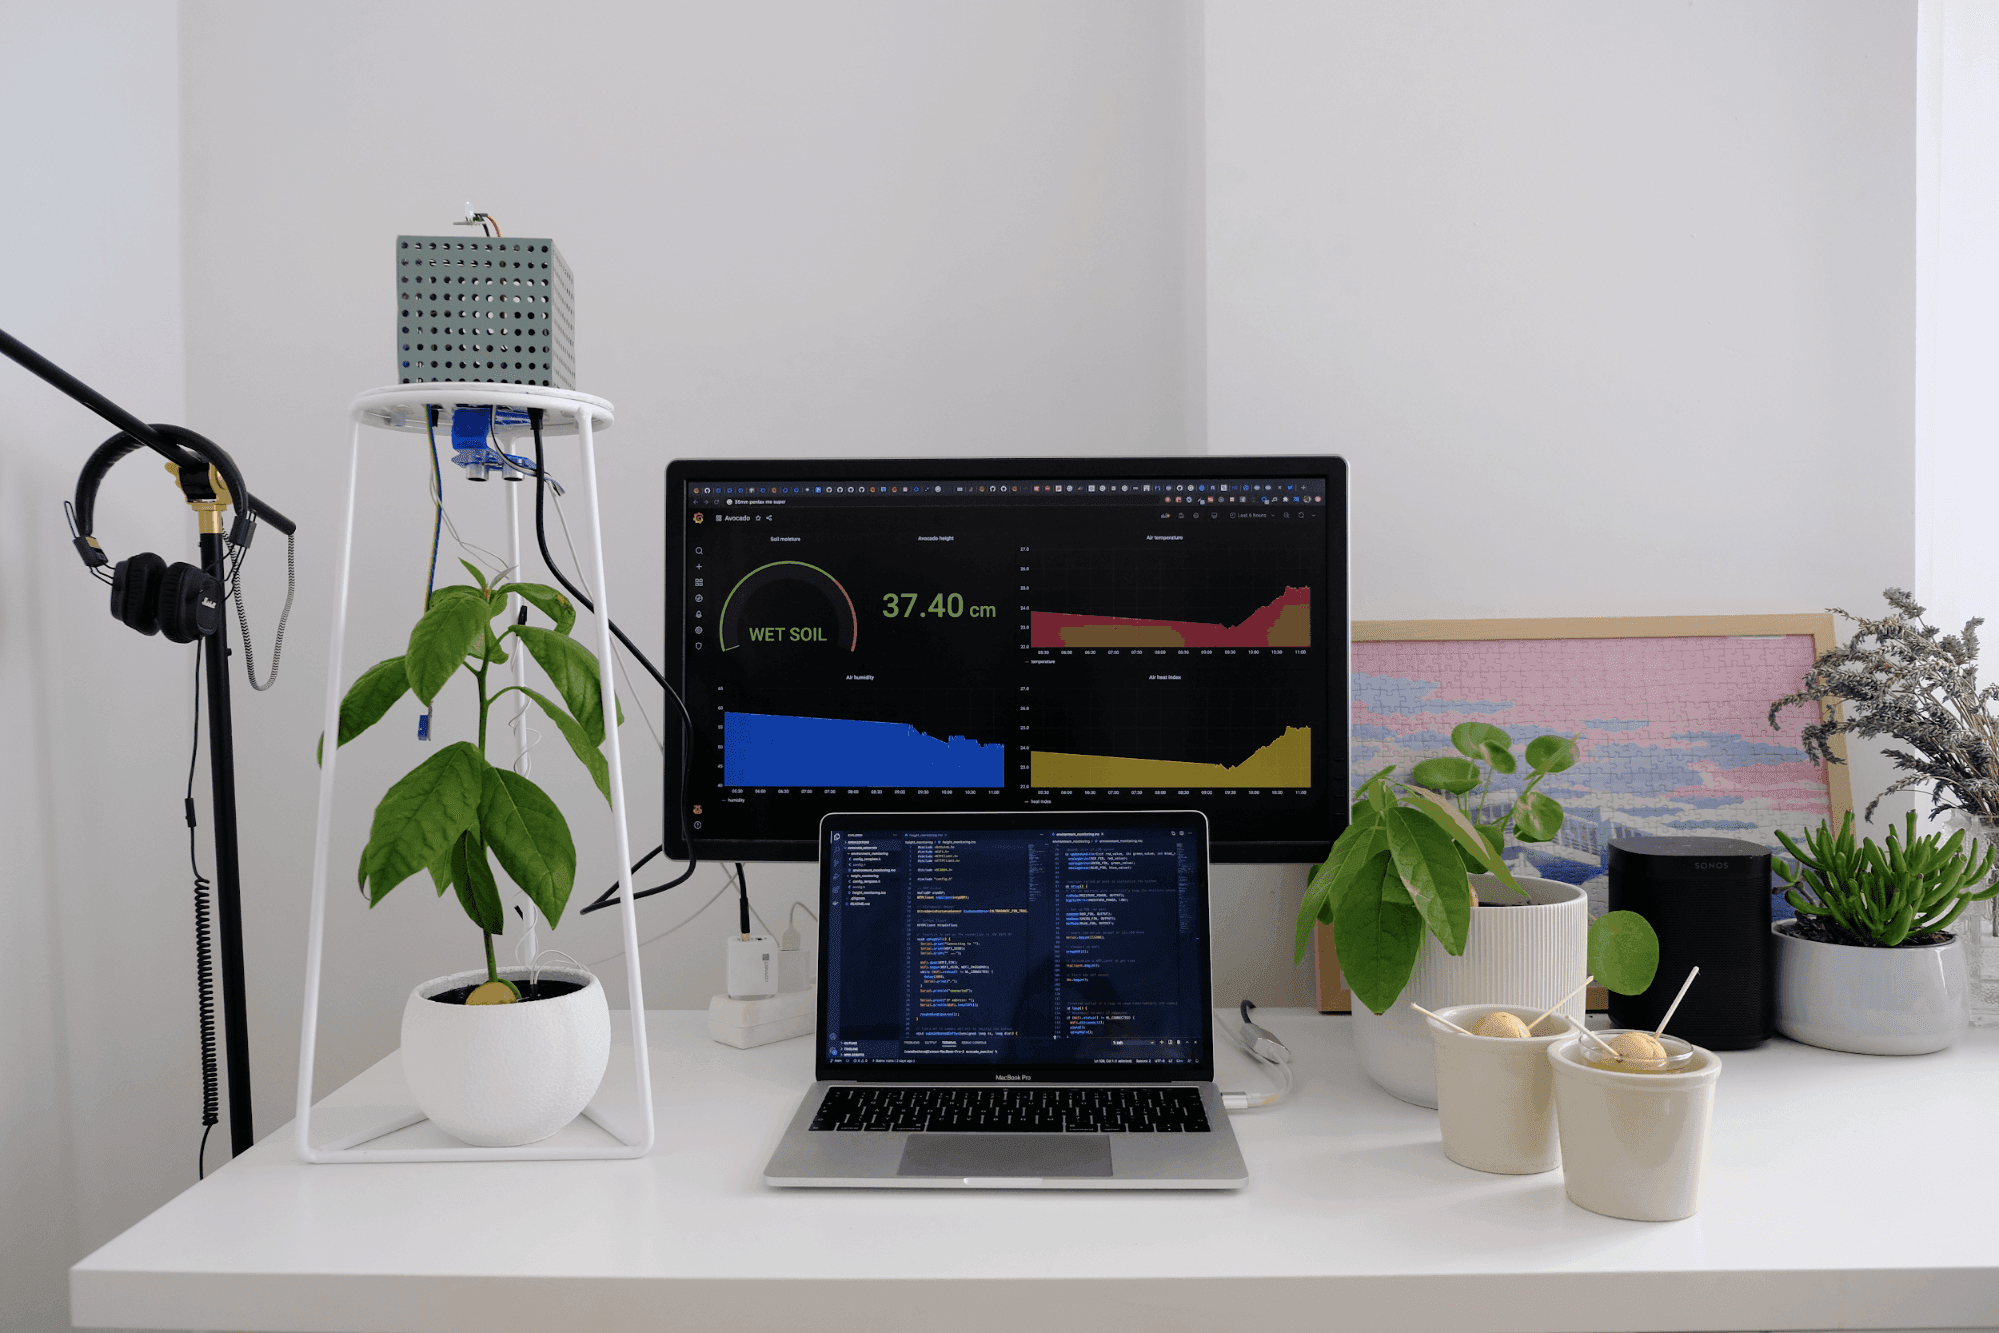
How I built a monitoring system for my avocado plant with Arduino and Grafana CloudGrafana CloudGrafanaIoTMonitoring
Meet the Grafana Labs team: Recruiter Michaela Guzzi, who is helping to build our Go-to-Market teamTeam
Why we’re partnering with Elastic to build the Elasticsearch plugin for GrafanaElasticsearchPluginsGrafana
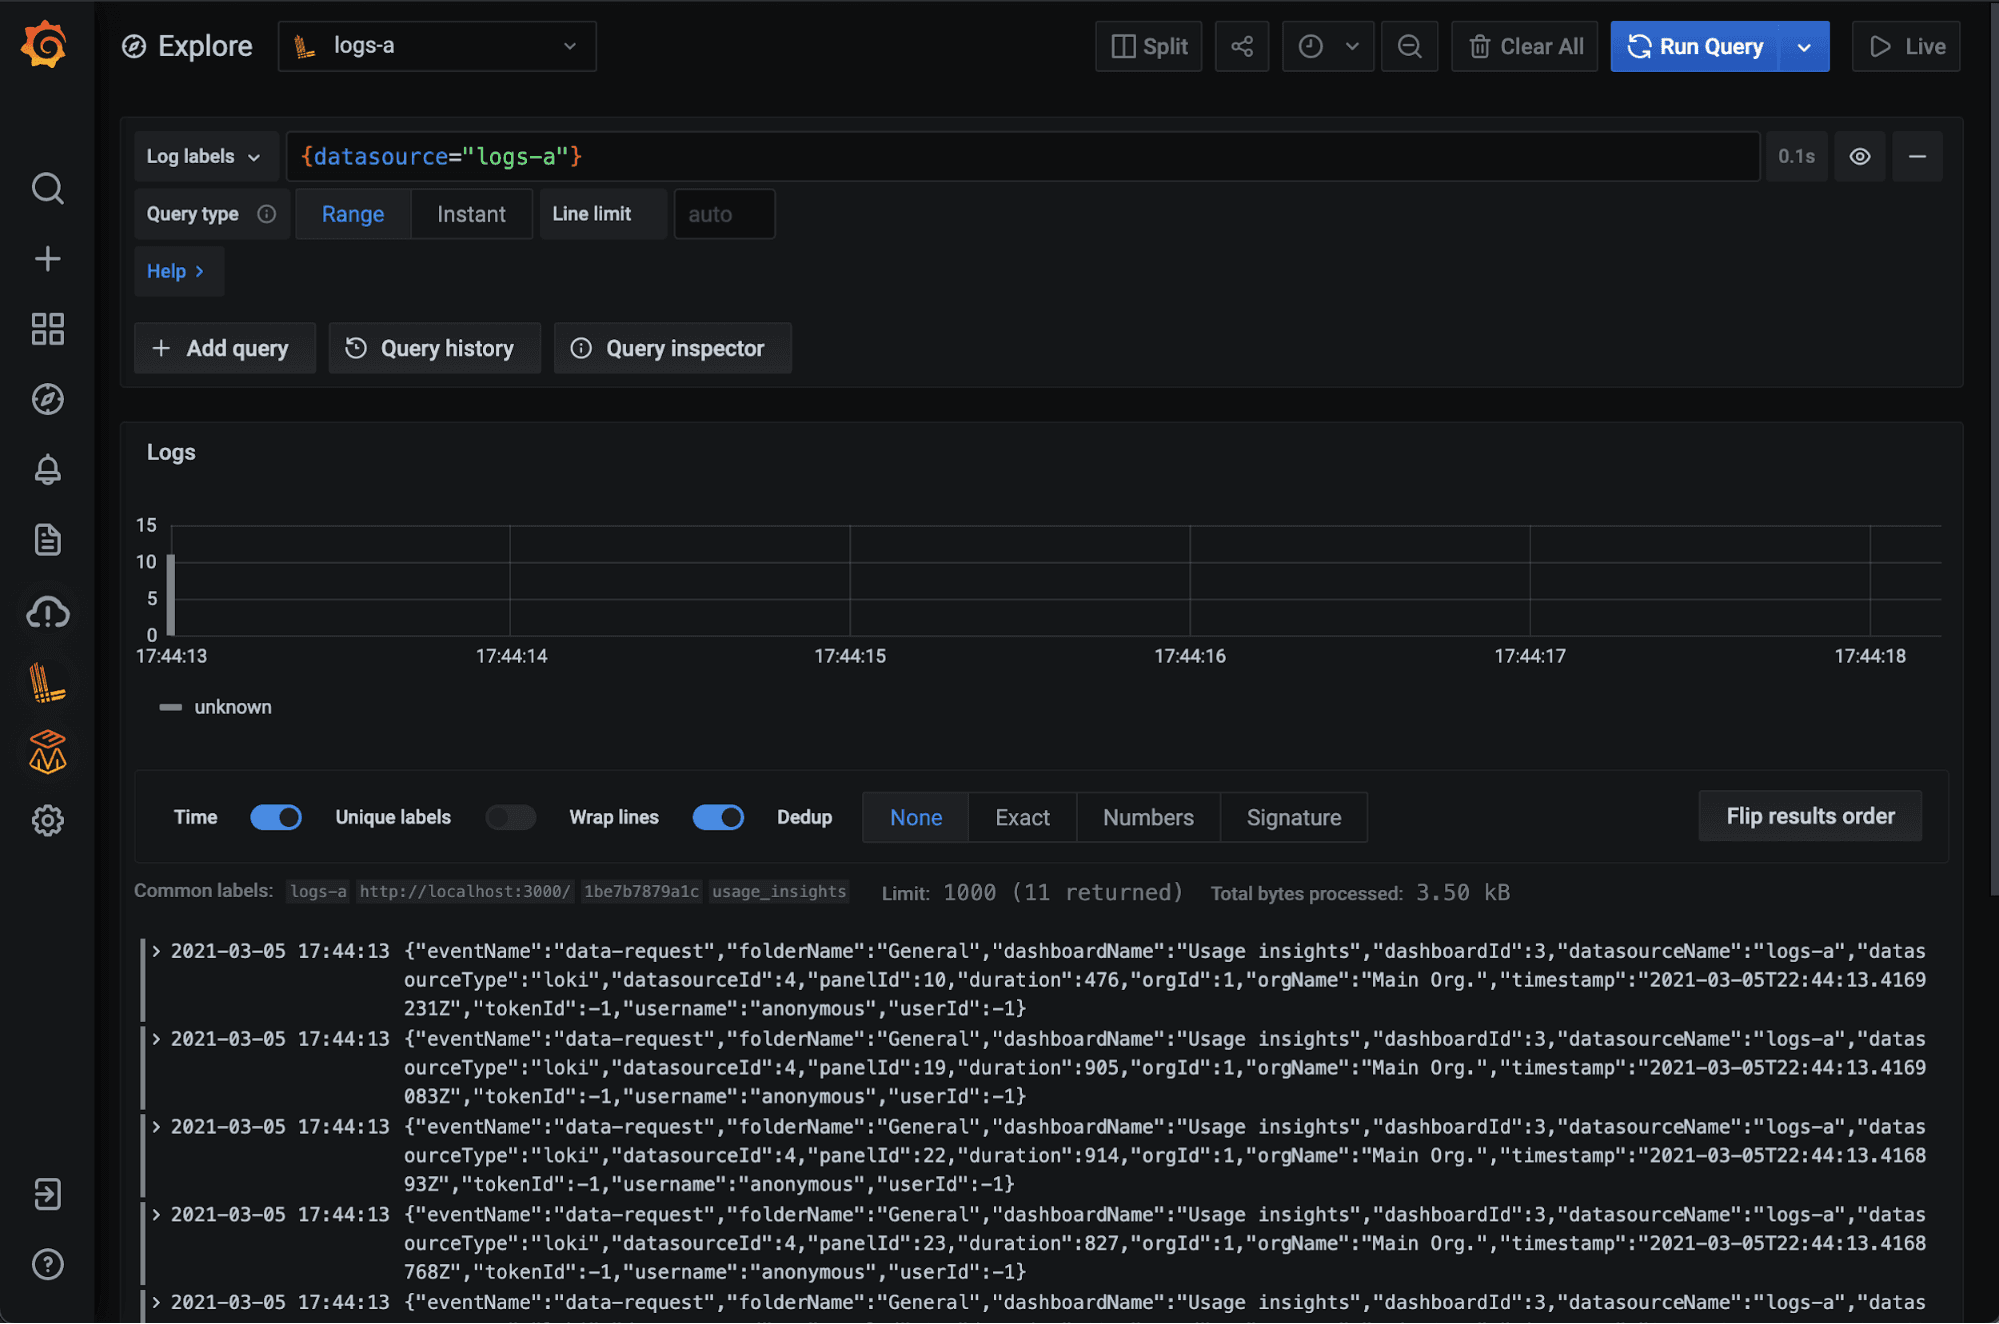
New in Grafana 7.4: Export usage data to Loki to help manage dashboard sprawl and troubleshoot fasterGrafanaLokiDashboard
Don’t miss our new series of live demo webinars kicking off March 4: Getting started with Grafana and observabilityEventsObservabilityLokiPrometheus
Cost attribution in Grafana Cloud: Manage spend across observability and testing workflows Grafana CloudCost managementSynthetic monitoringPerformance Testing
Explore what's next in agentic operations: Introducing AI WeekWe're excited to show you what's new in AI for observability and observability for AI—and for you to get hands on with all the latest AI tools during our first ever AI Week.AI
Grafana Labs named a Leader again in the 2026 Gartner® Magic Quadrant™ for Observability PlatformsObservabilityGrafana Cloud
Grafana 13.1 release: observability as code updates, extending Grafana Assistant across more data sources, and moreGrafanaRelease
Stop switching tools to find answers: Grafana Assistant now works across 30+ data sourcesAIGrafanaIntegrations
'Grafana's Big Tent' podcast: Anthropic on agentic coding, observability, and the future of software engineeringPodcastsAIObservability