Easily monitor and alert on your Kubernetes clusters with the new Grafana Cloud integrationGrafana CloudGrafana AgentKubernetesIntegrations
Monitor your production line with the new Grafana Enterprise data source plugin for SAP HANA®GrafanaGrafana EnterprisePlugins
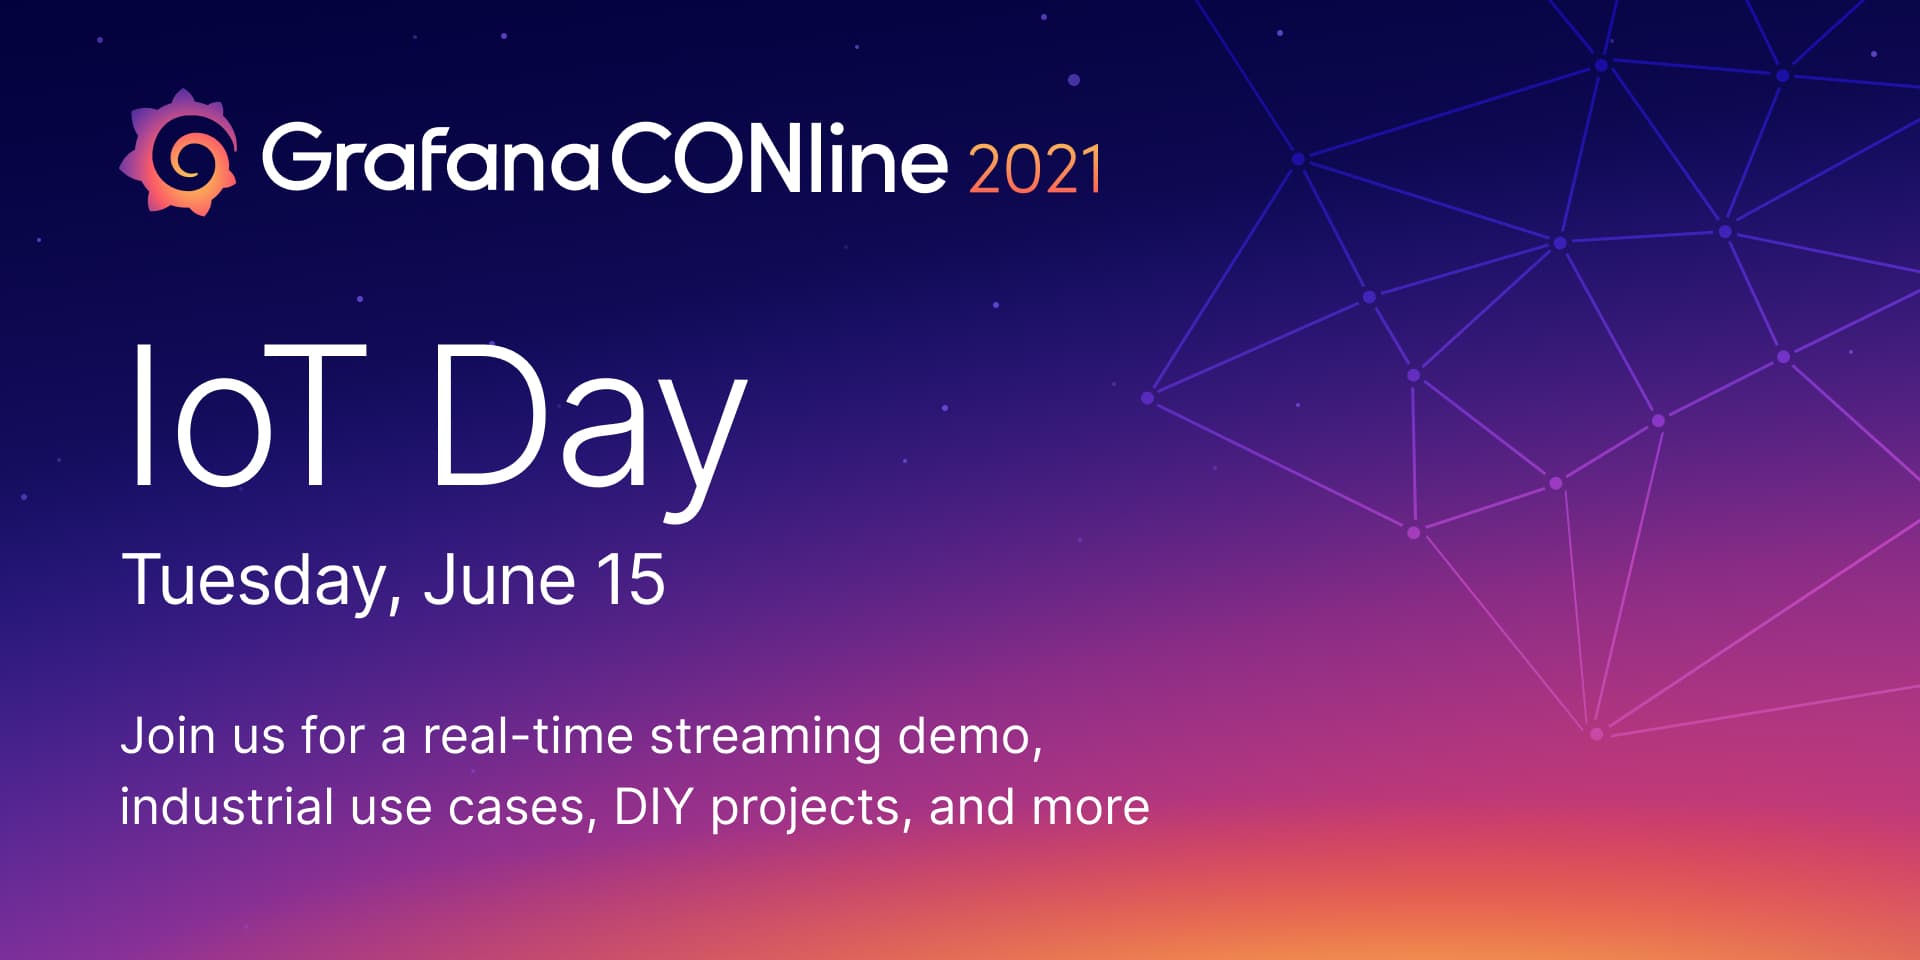
Join us for IoT Day at GrafanaCONline: Real-time streaming demo, industrial use cases, DIY projects, and moreIoTGrafanaEventsGrafanaCon
How shuffle sharding in Cortex leads to better scalability and more isolation for PrometheusPrometheusMimir
Get started with distributed tracing and Grafana Tempo using foobar, a demo written in PythonTempoTracingPython
KubeCon + CloudNativeCon Europe 2021 preview: Grafana Labs team members talk about Cortex, Prometheus, observability, and distributed tracingEventsMimirPrometheusJaegerObservabilityKubeCon
PromCon 2021 preview: Prometheus remote write, Cortex blocks storage, histograms, and moreMimirPrometheus
What’s new in Grafana Enterprise Metrics 1.3, our scalable, self-hosted Prometheus servicePrometheusPluginsGrafana Enterprise Metrics
Get instant Grafana dashboards for Prometheus metrics with the Elixir PromEx libraryDashboardGrafanaPrometheusElixir
Benchmarking Grafana Enterprise Metrics for horizontally scaling Prometheus up to 500 million active seriesMimirPrometheusGrafana Enterprise Metrics
How PayIt, a secure cloud service provider for digital government, uses Grafana and Prometheus for observability at cloud native scaleGrafanaPrometheusKubernetes
Identify anomalies, outlier detection, forecasting: How Grafana Cloud uses AI to make observability easierExplore how Grafana Cloud uses AI to help you spot anomalies earlier, explore your data through natural language, and find root causes faster.AIGrafana Cloud
Grafana Labs named a Leader again in the 2026 Gartner® Magic Quadrant™ for Observability PlatformsObservabilityGrafana Cloud
Knowledge Graph as context for LLMs: demonstrating decisive RCA and faster production performanceGrafana CloudAI
Digital Experience Monitoring with Grafana Cloud: Session Replay, synthetic checks, and faster investigationsSynthetic monitoringFrontend observabilityGrafana Cloud Frontend ObservabilityGrafana Cloud
Custom labels in Grafana Cloud Synthetic Monitoring: New updates for consistency and ease-of-useSynthetic monitoringGrafana Cloud
Identify anomalies, outlier detection, forecasting: How Grafana Cloud uses AI to make observability easierAIGrafana Cloud
Knowledge Graph as context for LLMs: demonstrating decisive RCA and faster production performanceGrafana CloudAI

%3Aquality(90)%2F&w=3840&q=75)
%3Aquality(90)%2F&w=3840&q=75)
%3Aquality(90)%2F&w=3840&q=75)
%3Aquality(90)%2F&w=3840&q=75)
%3Aquality(90)%2F&w=3840&q=75)
%3Aquality(90)%2F&w=3840&q=75)
%3Aquality(90)%2F&w=3840&q=75)
%3Aquality(90)%2F&w=3840&q=75)

%3Aquality(90)%2F&w=3840&q=75)
%3Aquality(90)%2F&w=3840&q=75)
%3Aquality(90)%2F&w=3840&q=75)
%3Aquality(90)%2F&w=3840&q=75)
%3Aquality(90)%2F&w=3840&q=75)
%3Aquality(90)%2F&w=3840&q=75)
%3Aquality(90)%2F&w=3840&q=75)
%3Aquality(90)%2F&w=3840&q=75)
%3Aquality(90)%2F&w=3840&q=75)
%3Aquality(90)%2F&w=3840&q=75)

%3Aquality(90)%2F&w=3840&q=75)
%3Aquality(90)%2F&w=3840&q=75)


%3Aquality(90)%2F&w=3840&q=75)
%3Aquality(90)%2F&w=3840&q=75)
%3Aquality(90)%2F&w=3840&q=75)

