ObservabilityCON 2021: Observability at scale with TomTom, Unity, TripAdvisor, Snyk, and CitibankObservabilityPrometheus
Introducing Grafana Machine Learning for Grafana Cloud, with metrics forecastingGrafana CloudMachine learning
KubeCon + CloudNativeCon NA 2021 preview: Attend our sessions on Prometheus, Jaeger, and moreEventsPrometheusJaegerKubeCon
The U.S. Department of Defense formally authorizes Grafana, Grafana Enterprise, and Loki for its 100,000 developersGrafanaGrafana EnterpriseLokiPrometheus
Meet the Grafana Labs team: Jita Chatterjee, a senior technical writer who improves open source documentation for GrafanaTeam
Don’t miss the live webinar on getting started with Grafana 8 at 8:00 UTC on Sept. 9EventsGrafanaPrometheusLoki
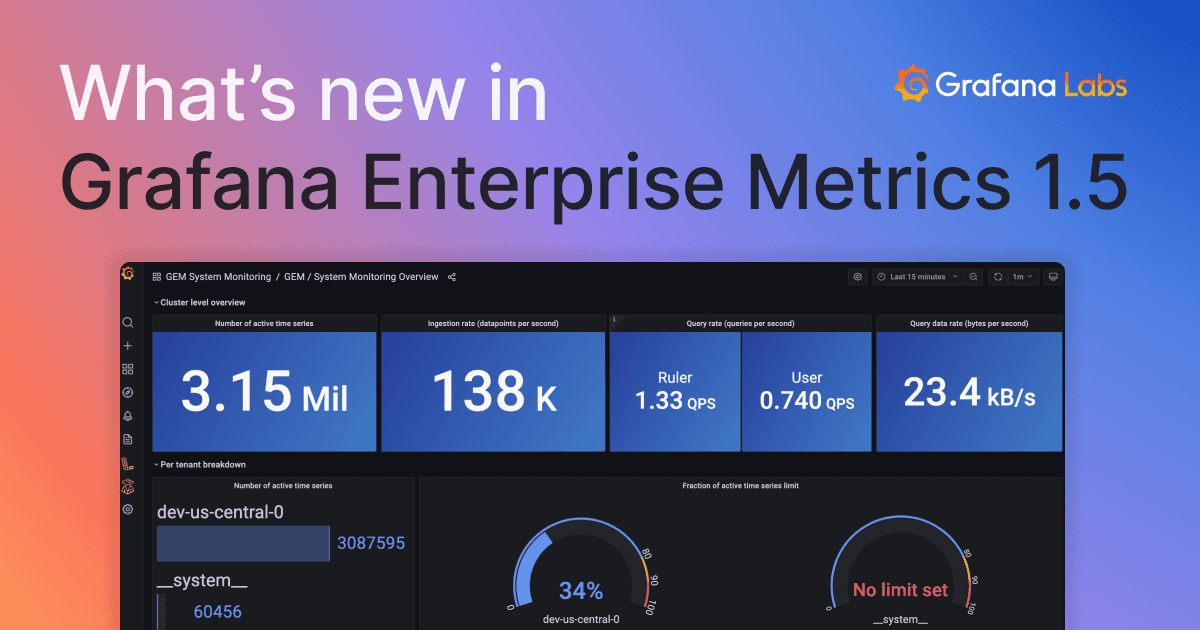
What’s new in Grafana Enterprise Metrics 1.5: Per-tenant usage metrics and a wildcard tenant for queriesGrafana Enterprise MetricsPrometheus
Don’t miss tomorrow’s intro-level webinar on scaling Prometheus and Graphite metrics with GrafanaPrometheusGraphiteGrafanaGrafana Enterprise MetricsGrafana Cloud
Meet the Grafana Labs team: Nicole van der Hoeven, a developer advocate who does performance testing at k6Team
Grafana Labs joins the CNCF Governing Board as a Platinum member of the open source foundationCompany newsOpen SourcePrometheus