Learn how to use the Jira, ServiceNow, GitHub, and GitLab plugins for Grafana for better visibility into software developmentPlugins
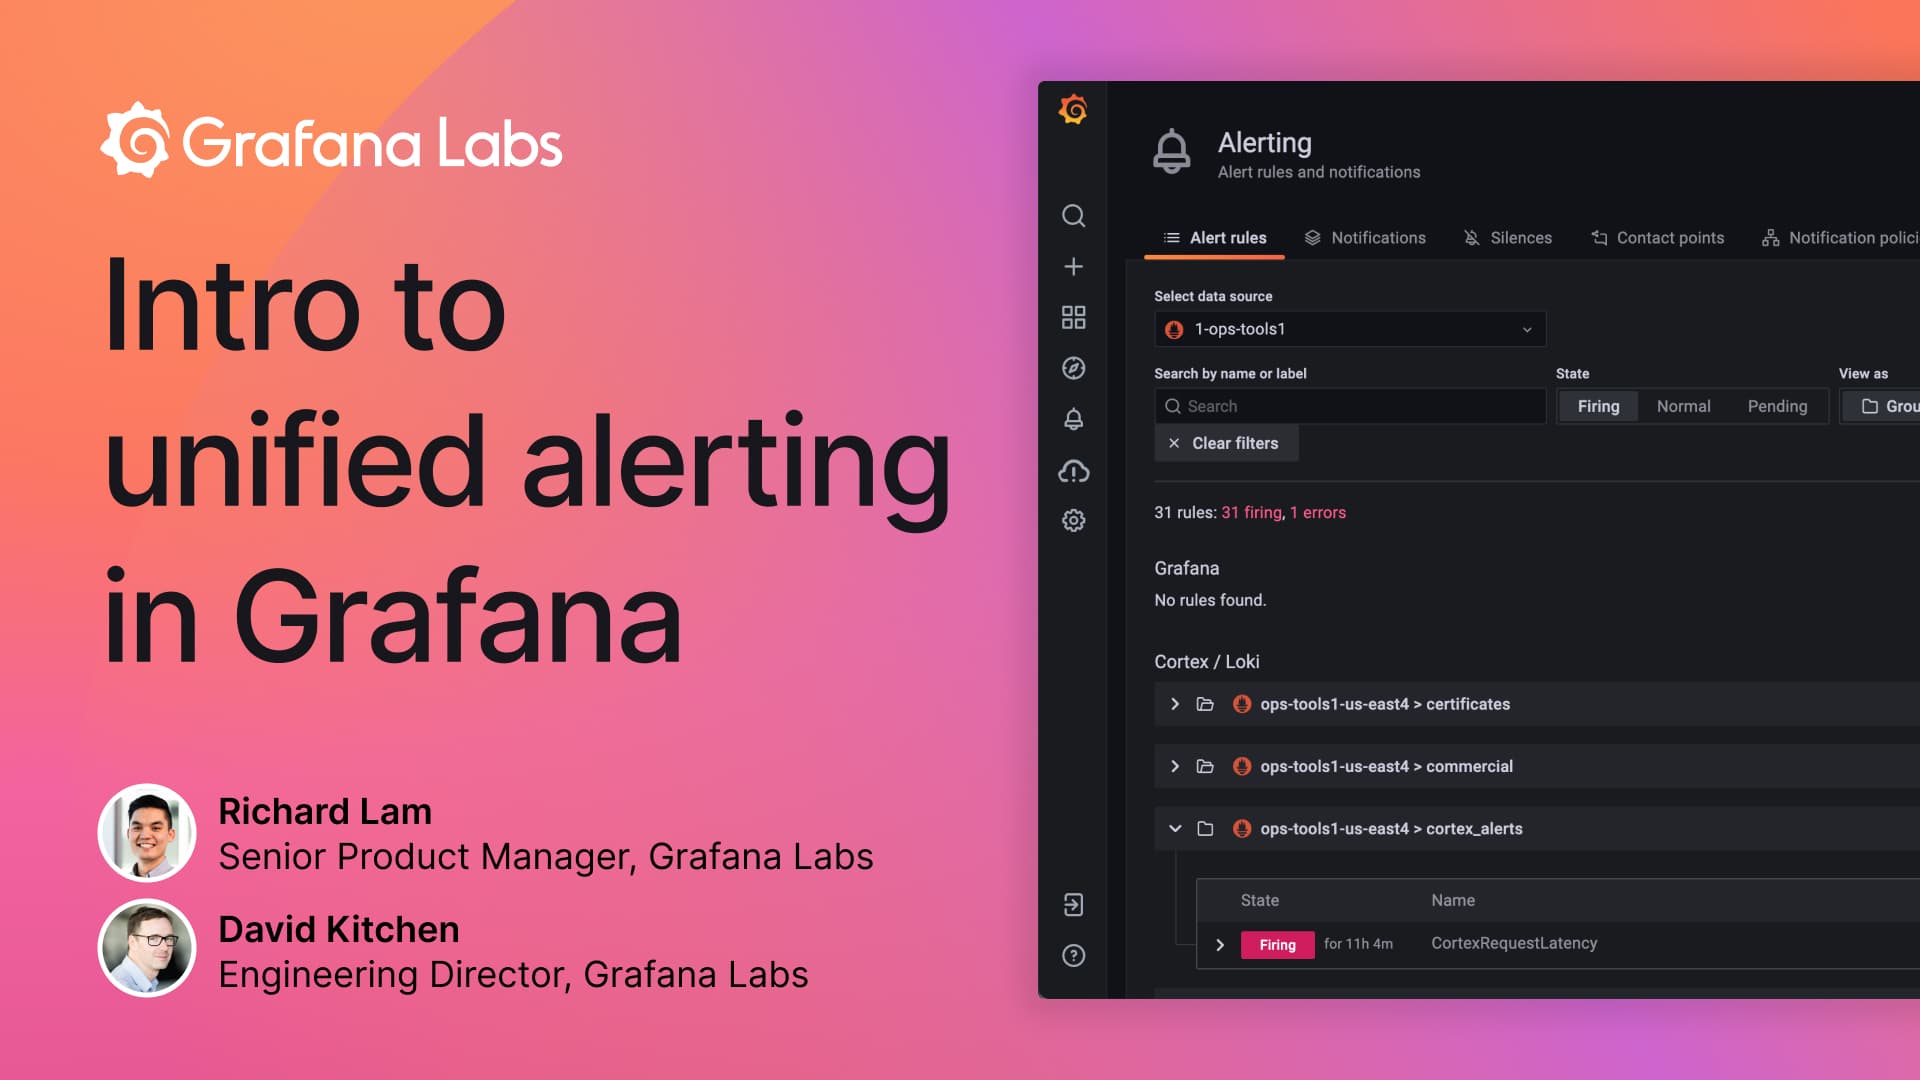
Learn more about the new alerting system in Grafana in this week’s webinarAlertingGrafanaGrafana CloudPrometheus
GrafanaCONline Day 6 recap: The latest on Loki for logs, Grafana for monitoring high performance computing, the business of Grafana Labs, and more!Events
GrafanaCONline 2021 Day 5 recap: Grafana alerting, dashboards as code, synthetic monitoring in Grafana Cloud, and more!AlertingGrafanaGrafana CloudGrafana EnterpriseGrafana Enterprise LogsGrafana Enterprise Metrics
GrafanaCONline IoT Day recap: Real-time streaming in Grafana 8, fun DIY projects, Grafana for trains, plants, and moreEvents
GrafanaCONline 2021 Day 3 recap: Grafana Tempo deep dive, plus how Grafana helps grow e-commerce, scale NFT platforms, and more!EventsTempoGrafana CloudGrafana AgentAWSTanka
GrafanaCONline Day 2 recap: Grafana 8 deep dive, Prometheus innovation, a billion time series at Robinhood, and moreEvents
GrafanaCONline Day 1 recap: Grafana 8, Tempo GA, machine learning, ISS, and more!GrafanaConGrafanaTempoGrafana CloudGrafana Enterprise
Meet the Grafana Labs team: Ryan Geyer, who creates dashboards to help users get started quickly with Grafana CloudTeamGrafana CloudIntegrations
KubeCon + CloudNativeCon Europe 2021 preview: Grafana Labs team members talk about Cortex, Prometheus, observability, and distributed tracingEventsMimirPrometheusJaegerObservabilityKubeCon
PromCon 2021 preview: Prometheus remote write, Cortex blocks storage, histograms, and moreMimirPrometheus
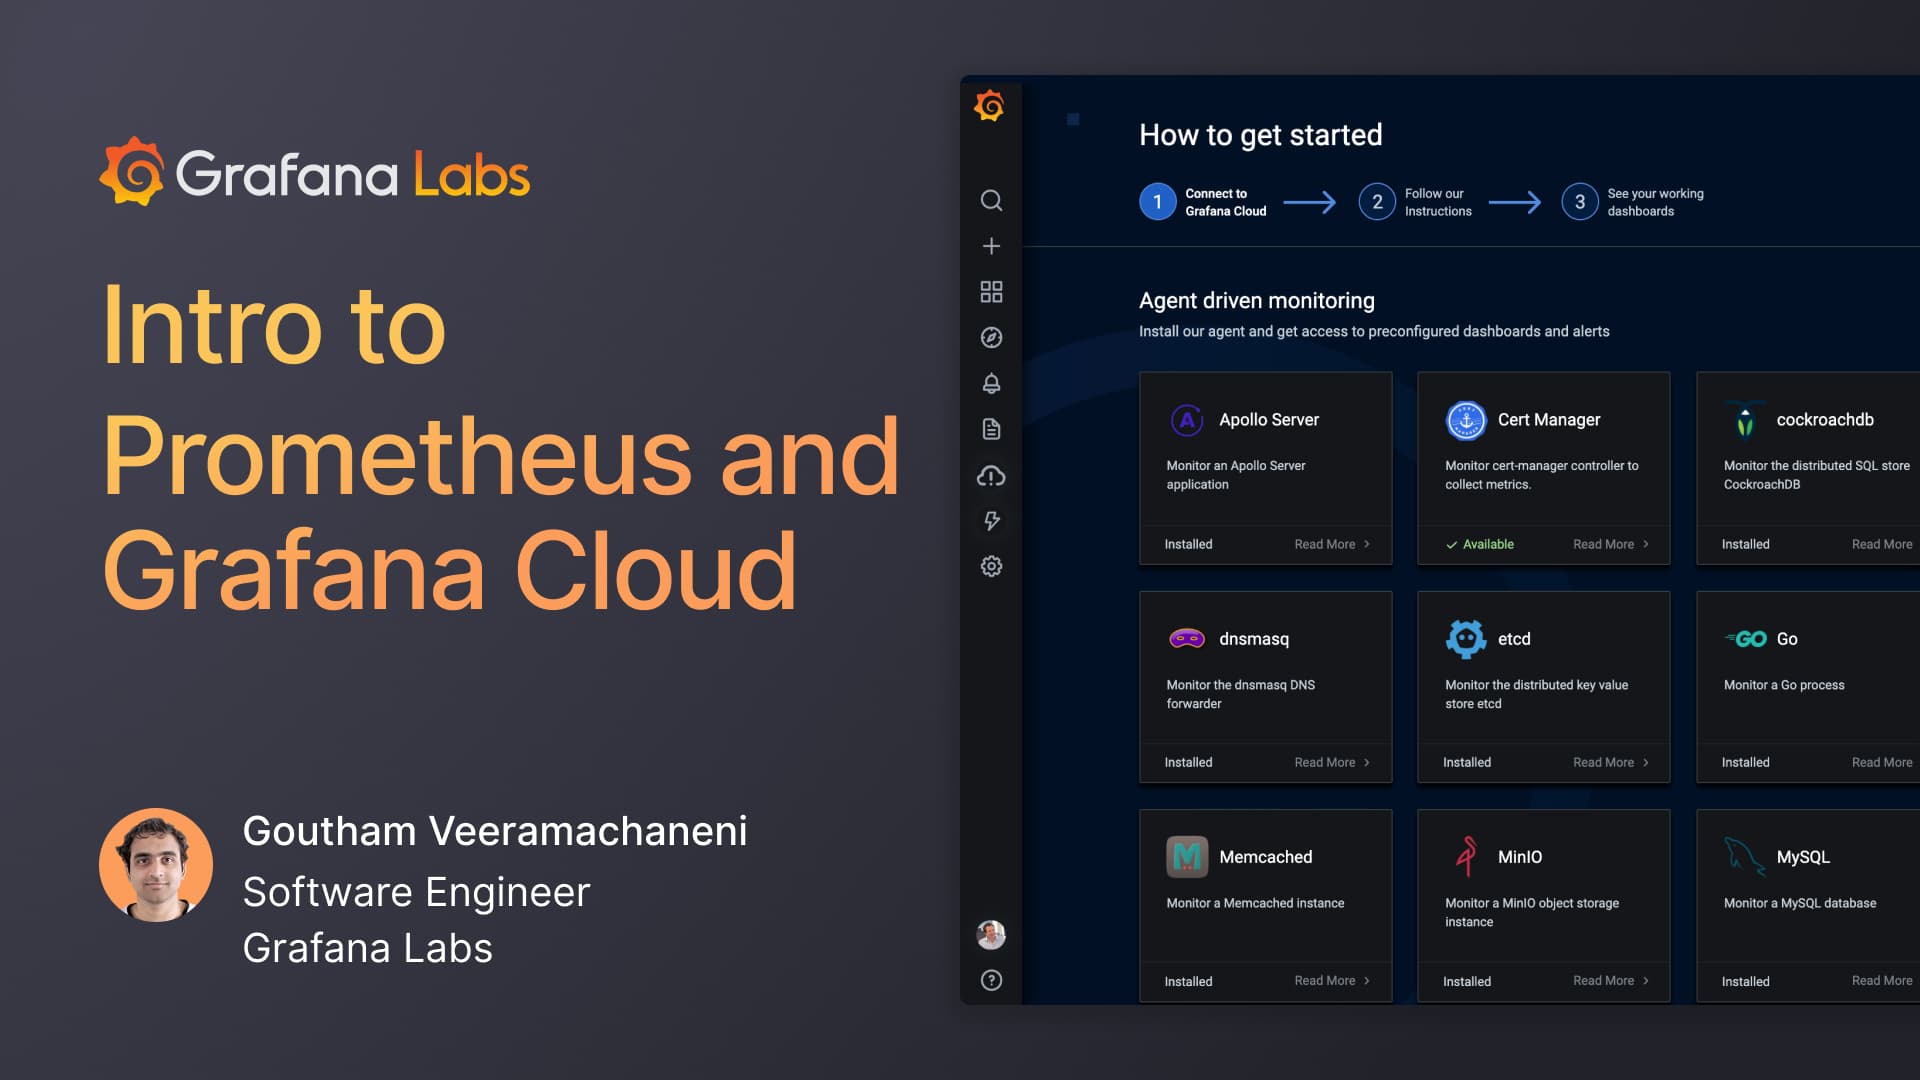
Don’t miss the Intro to Prometheus and Grafana Cloud webinar this weekGrafana CloudPrometheusObservability
Meet the Grafana Labs team: Daniel Palay, who helps customers and community members tell their success storiesTeam
Meet the Grafana Labs team: Natalia Bernarte, an engineering manager for the Grafana frontend platform teamTeam
Meet the Grafana Labs team: Software engineer Vicky Lee, who builds Enterprise plugins for GrafanaTeamGrafana EnterprisePlugins
Meet the Grafana Labs team: Uche Obasi, a software engineer who builds frontend Grafana featuresTeamGrafana