How to monitor Amazon Bedrock AgentCore AI agent infrastructure in Grafana CloudAWSCloud Provider ObservabilityIntegrations
AWS metric ingestion for less: Save money and get near real-time stream into Grafana CloudGrafana CloudAWSCloud Provider Observability
Observability for containerized workloads: How to run Grafana Beyla as a sidecar in Amazon ECSGrafana BeylaGrafana AlloyAWS
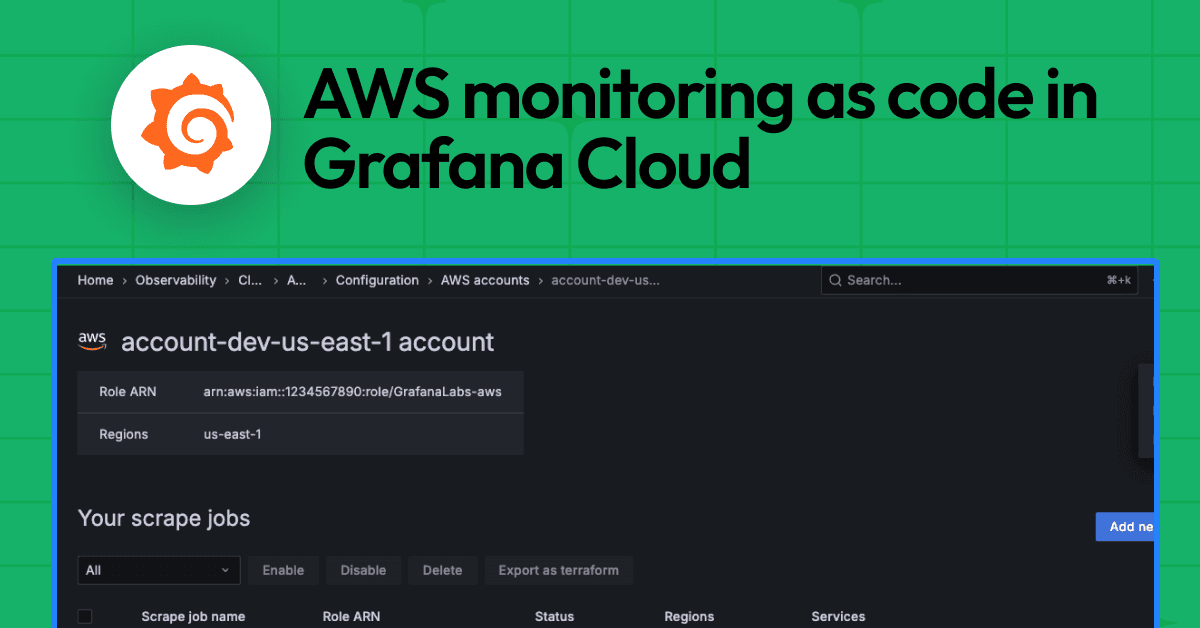
Grafana Cloud: Manage the AWS Observability app as code with TerraformAWSCloud Provider ObservabilityGrafana Cloud
How to observe AWS Lambda functions using the OpenTelemetry Collector and Grafana CloudOpenTelemetryAWSGrafana Cloud
Grafana 11.4 release: Introducing support for OpenSearch PPL and OpenSearch SQL in the AWS CloudWatch data source pluginGrafanaAWS
Grafana’s Prometheus libraries: How we built libraries to create a truly vendor-neutral data sourcePrometheusAWSPlugins
Multi-cloud monitoring made easy: monitor AWS, Microsoft Azure, and Google Cloud services all in one appGrafana CloudAWSCloud Provider Observability
Grafana security update: Grafana Loki and unintended data write attempts to Amazon S3 bucketsSecurityAWSLoki
How we use Grafana Alloy clustering to scrape nearly 20M Prometheus metricsGrafana AlloyAWSGrafana CloudMimir
Logs with Firehose: cost-effective AWS log streaming to Grafana CloudAWSGrafana CloudGrafana Enterprise LogsIntegrations
AWS Observability in Grafana Cloud: A simpler, more intuitive cloud monitoring appAWSObservabilityIntegrationsGrafana Cloud
Monitor Amazon EC2: key metrics for instances, regions, and more in one viewIntegrationsAWSObservability
How Grafana query caching and Amazon Timestream make dashboards faster and more cost-effectiveAWSGrafanaDashboard
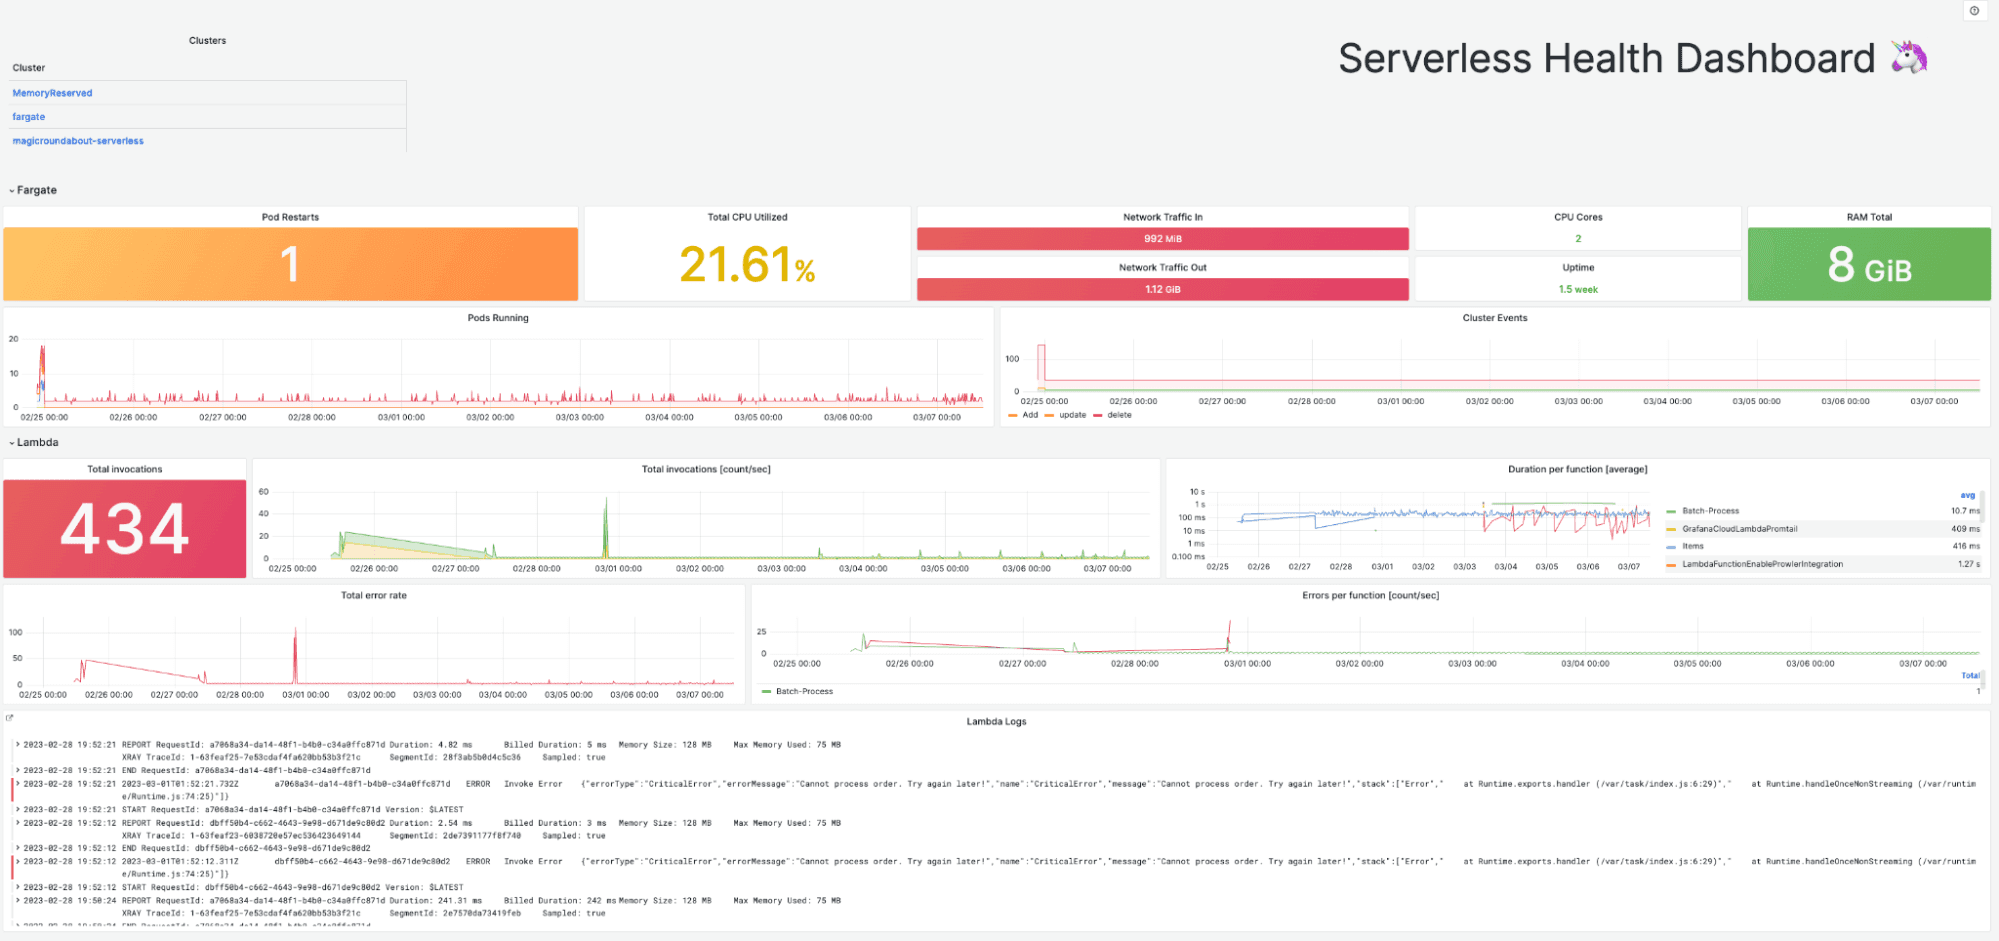
AWS Fargate monitoring: How to collect serverless logs, metrics, and traces in GrafanaAWSGrafana Agent
Grafana EMEA meetup recap: shift left observability, AI and load testing, monitoring plants, and morePrometheusk6MonitoringObservabilityGrafanaCommunityAWS