Fleet Management and Terraform: Use cases and best practices for managing collectors in Grafana CloudGrafana AlloyGrafana Cloud
Instrumentation Hub: a guided, scalable way to roll out observability coverage without losing controlGrafana AlloyGrafana CloudKubernetes MonitoringApplication observabilityeBPFOpenTelemetry
What's new in the Grafana Image Renderer: higher-quality results, security enhancements, and moreGrafanaGrafana CloudDashboard
Contextual, in-product guidance for every Grafana user: A closer look at Interactive LearningGrafanaGrafana Cloud
Improve service reliability and ops culture with Grafana Cloud Service Center AlertingSLOsGrafana CloudGrafana Cloud IRM
Monitor Temporal Workflows seamlessly: Introducing the Temporal Cloud integration for Grafana CloudIntegrationsGrafana Cloud
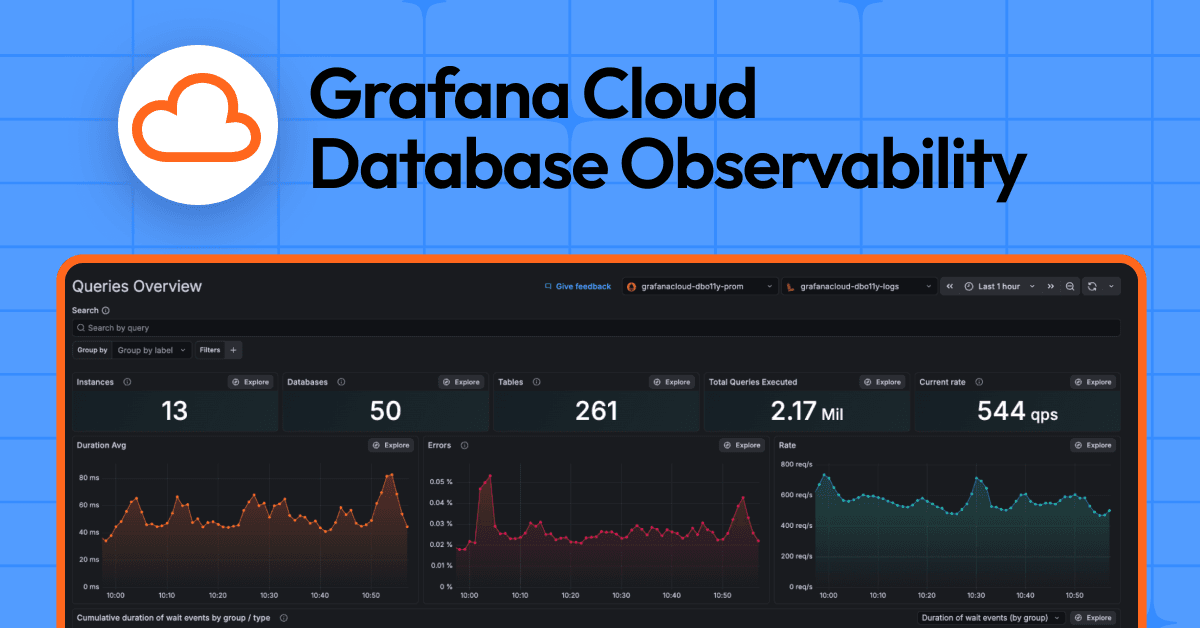
Understand, diagnose, and optimize SQL queries: Introducing Grafana Cloud Database ObservabilityInfrastructure observabilityGrafana Cloud
Prometheus native histograms in Grafana Cloud: Get more precision from your Grafana visualizations Grafana CloudPrometheusMimir
Faster, more collaborative data exploration: Introducing saved queries in Grafana CloudGrafana CloudDashboard
From pillars to rings: How interconnected observability in Grafana Cloud optimizes performance and reduces telemetry wasteGrafana Cloud
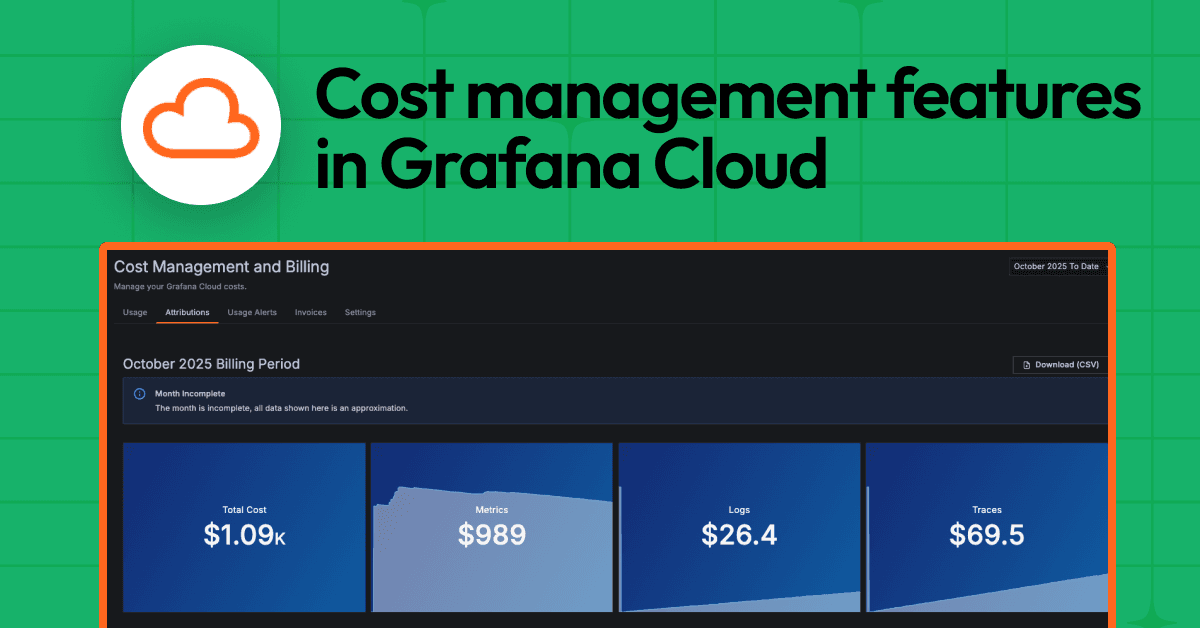
Managing observability costs at scale: A look at the latest cost management features in Grafana Cloud Grafana CloudCost management
Maximize data value and cut costs: Adaptive Telemetry for metrics, logs, traces, and profiles in Grafana CloudGrafana CloudCost managementAdaptive Telemetry
The observability maturity curve: How IT leaders are shifting from tools to outcomesGrafana CloudSLOsAI
Lighting up your dashboards: How to visualize the CheerLights IoT project in Grafana CloudGrafana CloudIoTDashboard
Measuring service response time and latency: How to perform a TCP check in Grafana Cloud Synthetic MonitoringGrafana CloudSynthetic monitoring
AWS metric ingestion for less: Save money and get near real-time stream into Grafana CloudGrafana CloudAWSCloud Provider Observability