Finding performance bottlenecks with Pyroscope and Alloy: An example using TON blockchainGrafana AlloyGrafana Pyroscope
How Prometheus Remote Write v2 can help cut network egress costs by as much as 50%PrometheusCost managementGrafana AlloyKubernetes Monitoring
Fleet Management and Terraform: Use cases and best practices for managing collectors in Grafana CloudGrafana AlloyGrafana Cloud
Instrumentation Hub: a guided, scalable way to roll out observability coverage without losing controlGrafana AlloyGrafana CloudKubernetes MonitoringApplication observabilityeBPFOpenTelemetry
Observability for containerized workloads: How to run Grafana Beyla as a sidecar in Amazon ECSGrafana BeylaGrafana AlloyAWS
Configure and customize Kubernetes Monitoring easier with Alloy OperatorKubernetes MonitoringGrafana Alloy
Grafana Alloy at 1: What’s new and what’s next for our OpenTelemetry Collector distributionGrafana Alloy
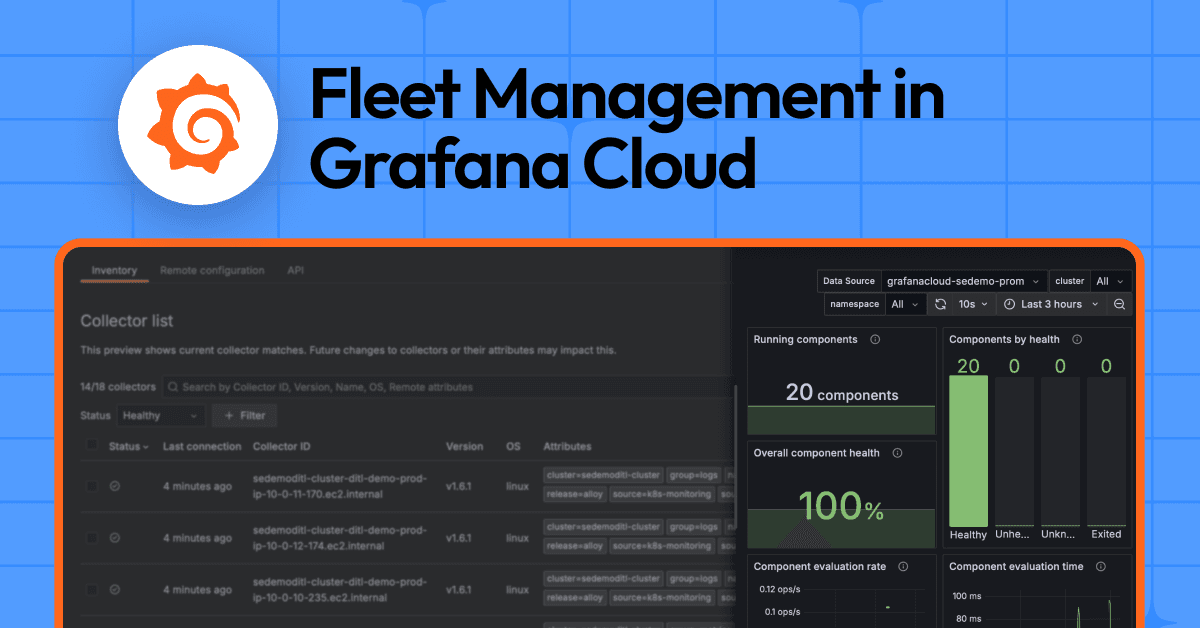
Telemetry pipeline management at any scale: Fleet Management in Grafana Cloud is generally availableGrafana AlloyGrafana Cloud
Grafana Loki 101: How to ingest logs with Alloy or the OpenTelemetry CollectorLokiPrometheusGrafana AlloyVideo
How to use OpenTelemetry and Grafana Alloy to convert delta to cumulative at scaleOpenTelemetryPrometheusGrafana Alloy
Metrics, logs, traces, and mayhem: introducing an observability adventure game powered by Grafana Alloy and OTelCommunityOpenTelemetryGrafana Alloy
Easily control observability collectors at scale with Fleet Management in Grafana CloudGrafana AlloyOpenTelemetry
How to quickly gain operational insights using Grafana Cloud monitoring solutionsGrafana CloudIntegrationsGrafana Alloy
How to integrate Okta logs with Grafana Loki for enhanced SIEM capabilitiesLoggingGrafana CloudLokiGrafana AlloySecurity
How to set up an open source database monitoring stack with Grafana CloudOpen SourceGrafana AlloyGrafana CloudPrometheus
How we use Grafana Alloy clustering to scrape nearly 20M Prometheus metricsGrafana AlloyAWSGrafana CloudMimir
How to use Grafana Beyla in Grafana Alloy for eBPF-based auto-instrumentationGrafana BeylaGrafana AlloyeBPF