How to monitor your Supabase projects: connect Grafana Cloud in one click


As AI agents accelerate software development and spin up applications at scale, visibility into what's happening behind the scenes, including query performance and database health, has never been more important. Gaining that level of insight requires observability that can keep pace.
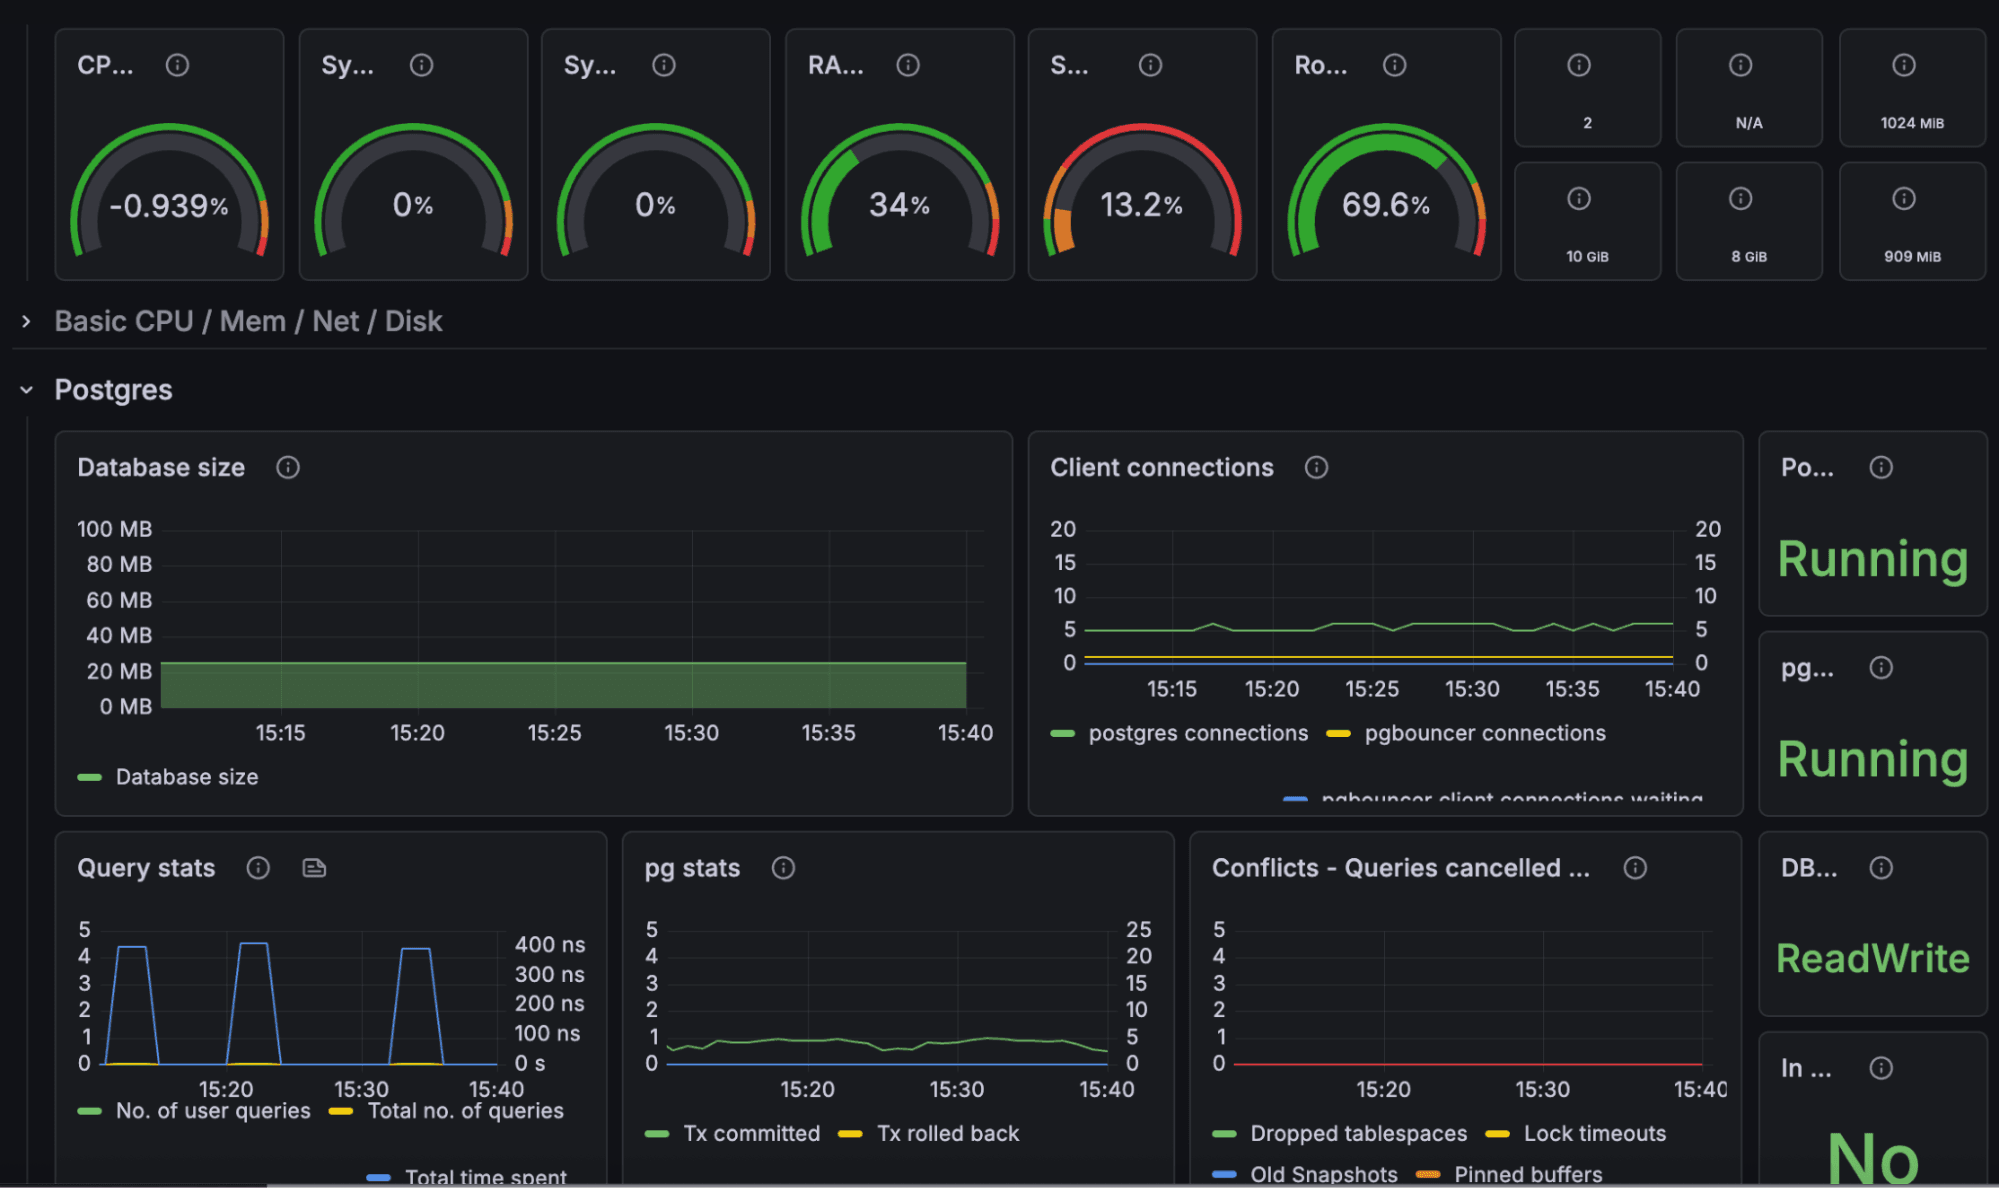
Supabase and Grafana Labs have partnered to launch a new integration available directly in Supabase, bringing production-grade observability to Supabase projects with a single click. Supabase users can now activate Grafana Cloud directly from their Supabase Dashboard to access key Supabase and Postgres metrics for their apps. With an out-of-the-box Grafana Cloud dashboard, you can track performance, identify issues, and understand system health from day one, knowing your monitoring and development will always stay in sync as you iterate.
"We rely on Grafana for observing our production systems internally and are excited to make it seamless for Supabase users to get the same deep insights into their product," said Matthew Linkous, Marketplace Lead at Supabase.
What is Supabase?
Supabase is an open source managed Postgres platform with an integrated suite of backend services, including Auth, Storage, Edge Functions, Realtime, and Vector search. With more than 9 million developers building everything from weekend projects to production apps at scale, Supabase is the fastest way to go from idea to deployed backend without stitching together multiple services or sacrificing control over your infrastructure.
Supabase was built on the belief that developers shouldn't have to choose between a great developer experience and the portability that comes with open source. Grafana Cloud was built with the same commitment to open standards in the observability space. Integrating the two platforms lets Supabase users extend the open, composable model they already rely on for their backend stack to their observability strategy, directly from the Supabase platform.
Why Grafana Cloud and Supabase?
Shipping an app on Supabase is fast. The backend is ready before your first commit, the database is running before you've picked a frontend framework, and you can be in production before most teams have finished provisioning a VPC.
Now building an observability strategy around that app can be just as simple. The Grafana Cloud integration combines the strengths of both platforms so teams can spend less time wiring up observability and more time shipping. With a single button, you get comprehensive visibility into your development environment. You can monitor the exact metrics that matter most during pre-production testing, including Postgres and PgBouncer health, active database connections, and database disk usage.
The integration also helps you track granular query and transaction activity, highlighting queries canceled due to conflicts, so you can catch performance bottlenecks, optimize heavy queries, and resolve deadlocks before they reach production.
Key benefits include:
- One-click provisioning: Previously, connecting Supabase with Grafana Cloud was a multi-step process. The integration now enables Grafana Cloud directly from the Supabase Dashboard with a single button. Credentials are handled for you, and metrics start flowing: no scrape jobs, no agents, and nothing to configure.
- An out-of-the-box dashboard: The dashboard is installed automatically in your Grafana Cloud workspace, which includes project performance signals and Postgres metrics in one pre-built view, with no panels to assemble.
- Metrics that matter, without the plumbing: Supabase performance metrics and supplementary Postgres metrics are pulled directly from the Supabase Metrics API in near real time.
- Free forever tier: The Grafana Cloud free tier includes 10k active metrics series and 14-day retention, which is enough for most Supabase projects to get real value with no credit card required.
- AI-powered observability: Grafana Assistant, the AI agent in Grafana Cloud, can build and organize dashboards, create alerts, troubleshoot issues, and more.
- Room to grow into the full Grafana Cloud stack: As your project grows, the same Grafana Cloud workspace scales with you: solutions for alerting, SLOs, traces, frontend observability, and performance testing are all available on the same platform.
For developers already running Grafana Cloud, Supabase now joins the same single pane of glass you use to monitor your applications, Kubernetes, and the rest of your infrastructure. For Supabase users new to Grafana Cloud, this integration is your fastest path to production-grade observability.
How to start monitoring your projects with Grafana Cloud
Setting up the integration takes less than a minute:
- Open your Supabase project and go to the Integrations section of the project dashboard.
- Select Grafana Cloud Observability Platform, then click Install.
- Choose an existing Grafana Cloud workspace or create a new one. New accounts land on the free tier by default.
- Authorize the connection. Supabase and Grafana Cloud exchange credentials securely; no secret keys to copy around.
- That’s it—you're in Grafana Cloud. Metrics start flowing immediately, and the Supabase project dashboard is already installed when you arrive.
Once the integration is set up, a brief tutorial walks you through your new dashboard, pointing out key metrics and showing you how to invite teammates, configure alerts, and use Grafana Assistant. From there, you can use the assistant to handle most tasks, including customizing your dashboard and building alerts on the metrics that matter most to your team.
To learn more about the Grafana Cloud and Supabase integration, check out our Supabase integration page and Supabase’s blog.
We intend to improve this experience over time. If you have any feedback, we encourage you to send it to integrations@grafana.com.
Bring Grafana Cloud to your platform
If you run a developer platform and want to offer your users the same one-click Grafana Cloud experience Supabase users now have, we'd like to talk. Please reach out at integrations@grafana.com to connect with our partnerships team and learn more about building a native Grafana Cloud integration into your product.
Grafana Assistant is the easiest way to get started with metrics, logs, traces, dashboards, and more in Grafana Cloud. We have a generous forever-free tier and plans for every use case. Sign up for free now!