Performance testing best practices: How to prepare for peak demand with Grafana Cloud k6k6Grafana Cloud k6Performance Testing
Distributed performance testing for Kubernetes environments: Grafana k6 Operator 1.0 is herek6Performance TestingKubernetesLoad testing
Implementing Grafana Play privacy policies with Grafana k6: A behind-the-scenes lookGrafanaCommunityk6
Reliable, predictable, and scalable performance testing: Grafana k6 1.0 is herek6Performance TestingLoad testing
An open source app for easily building performance tests: Grafana k6 Studio is generally availablek6Grafana Cloud k6Performance Testing
How to integrate performance testing and continuous profiling for deeper application insightsPerformance TestingLoad testingGrafana Cloud k6Grafana Cloud Profilesk6Grafana Pyroscope
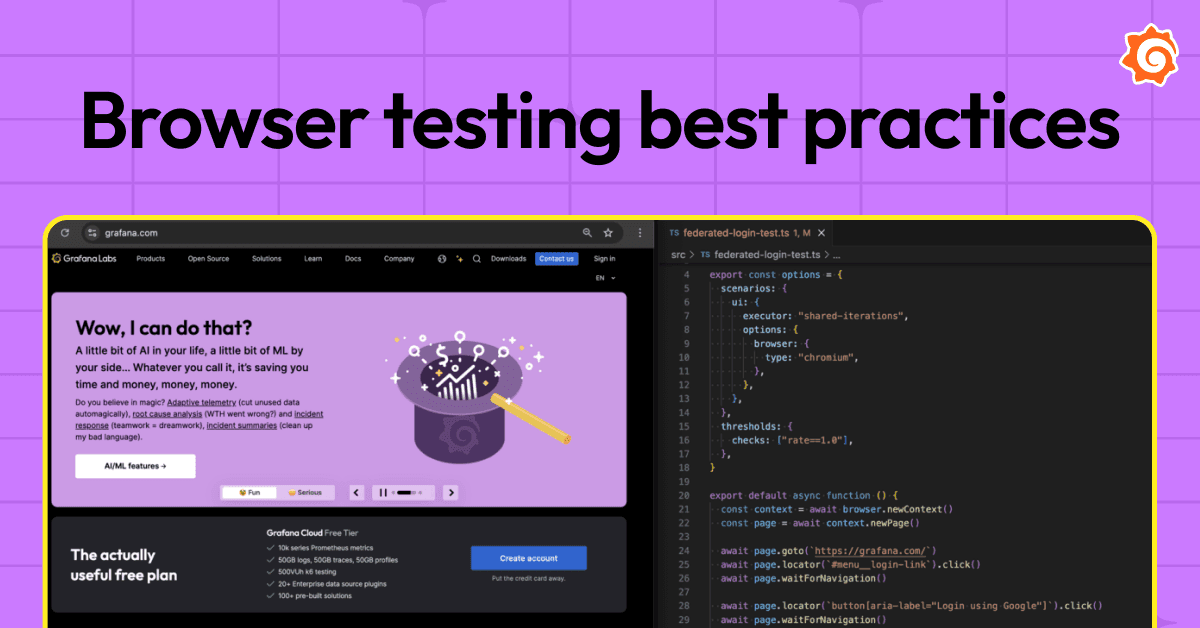
5 tips to write better browser tests for performance testing and synthetic monitoringGrafana Cloud k6k6Synthetic monitoringPerformance Testing
Setting up your Grafana k6 performance testing suite: JavaScript tools, shared libraries, and morek6Grafana Cloud k6Performance Testing
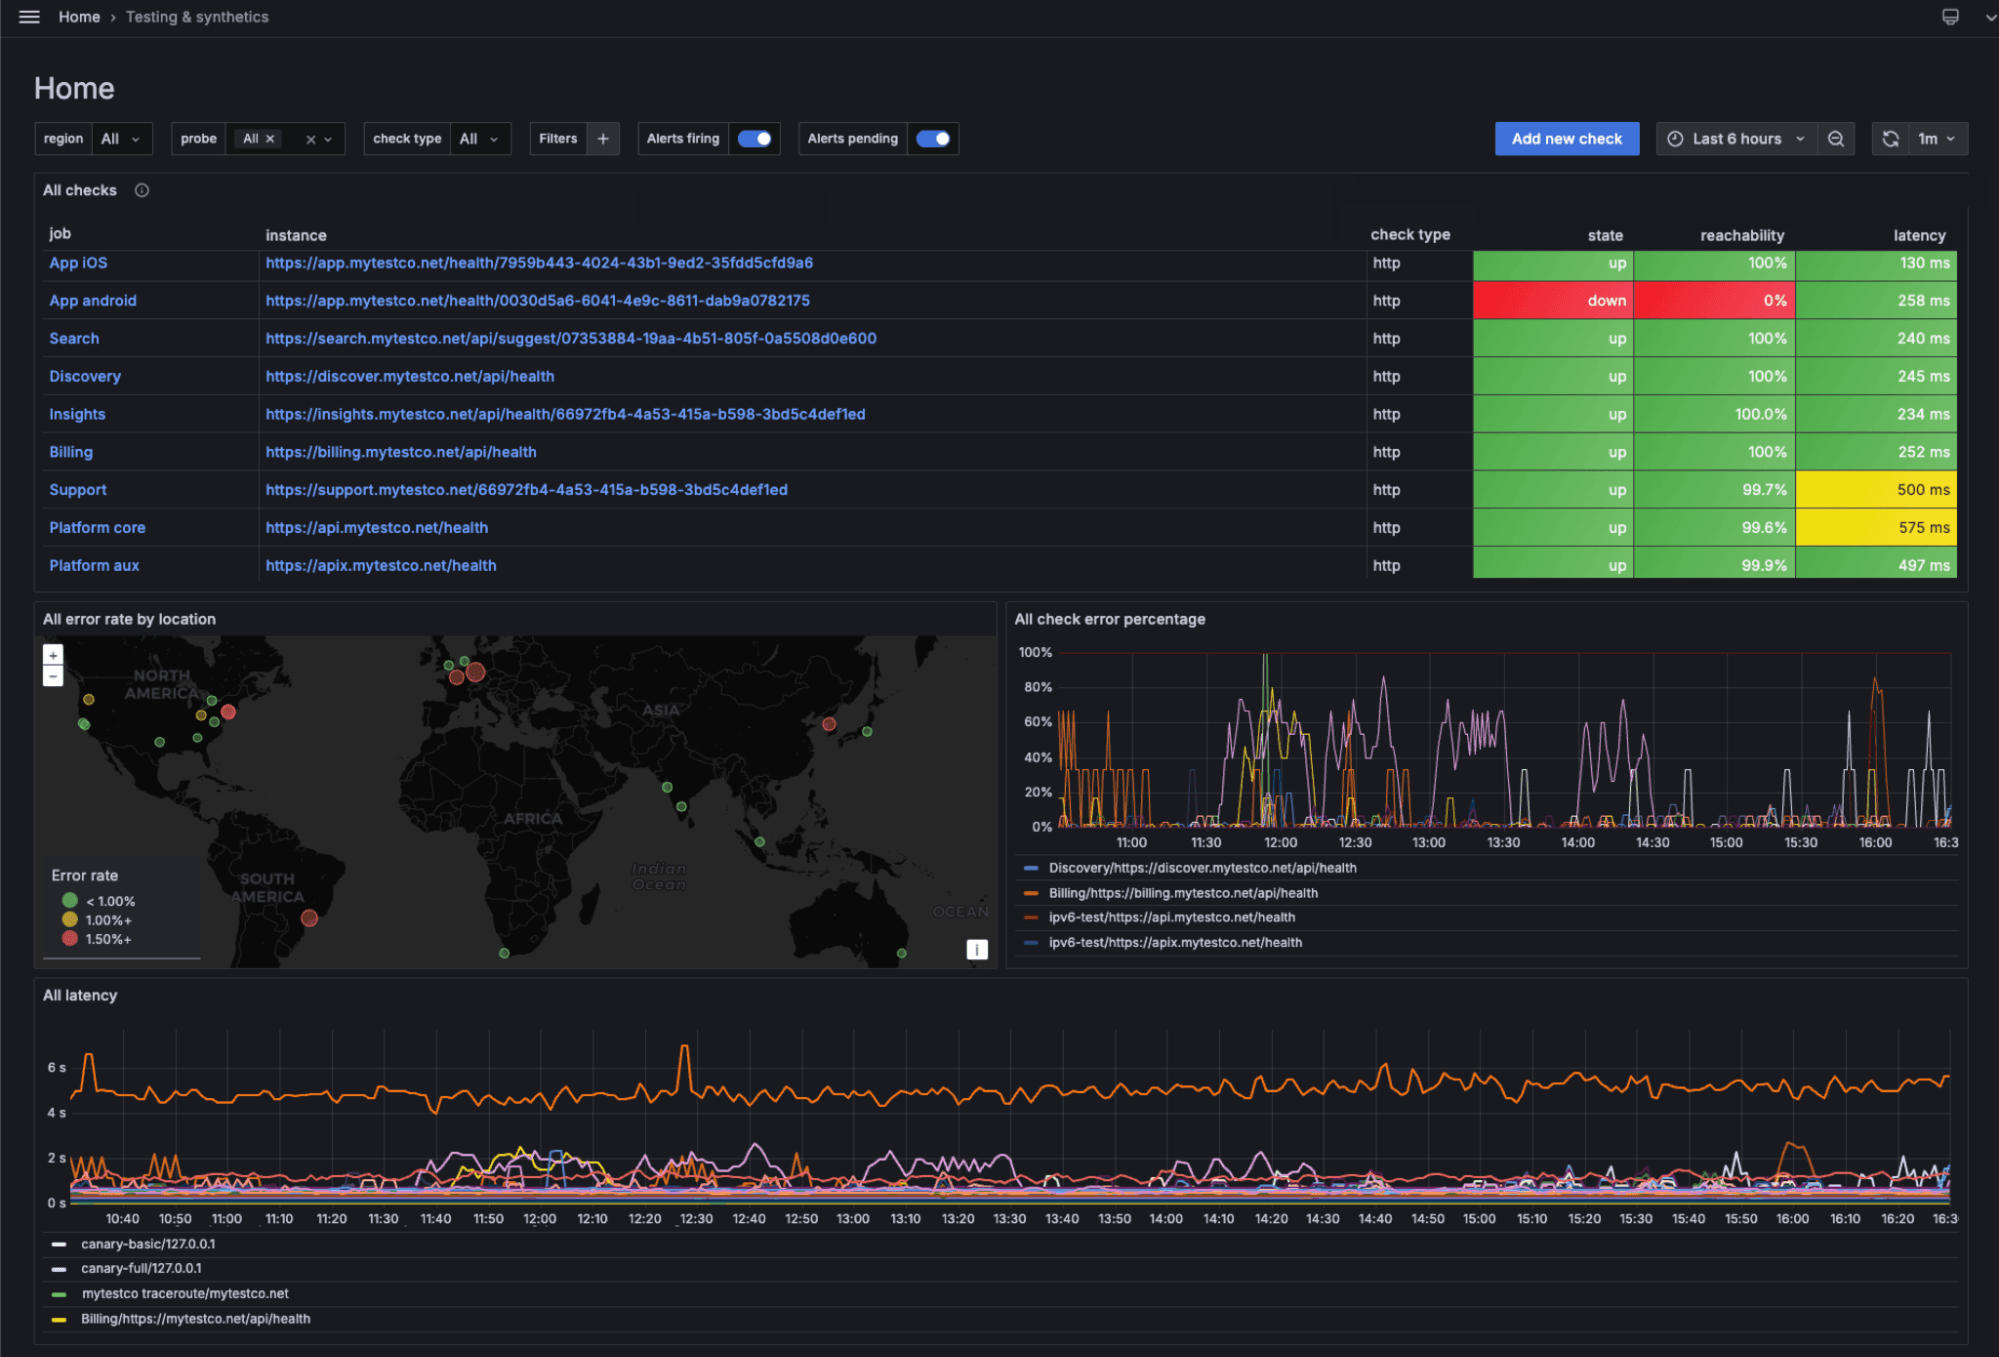
Grafana Cloud Synthetic Monitoring: How to simulate user journeys to ensure the best possible end-user experienceSynthetic monitoringGrafana Cloudk6
Organizing your Grafana k6 performance testing suite: Best practices to get startedk6Grafana Cloud k6Performance Testing
New in Grafana k6: The latest OSS features in v0.49.0 and static IPs in Grafana Cloud k6k6Grafana Cloud k6Engineering
Load testing tools: Open source considerations for homegrown solutionsk6Load testingPerformance Testing
New in Grafana k6: The latest OSS features in v0.47.0 and more efficient performance testing in Grafana Cloud k6k6Engineering