Introducing an OpenTelemetry Collector distribution with built-in Prometheus pipelines: Grafana AlloyGrafana AgentGrafana Alloy
From Agent to Alloy: Why we transitioned to the Alloy collector and why you should, tooGrafana AgentGrafana Alloy
Grafana Agent v0.37: Feature parity between Static and Flow mode, easy migration configs, and moreGrafana Agent
Grafana Agent v0.35 release: horizontal auto scaling, easy Flow mode migration, and moreGrafana Agent
Grafana Agent v0.34 release: Extended Kubernetes monitoring, support for HashiCorp Vault, and moreGrafana Agent
Grafana Agent v0.33 release: reusable pipelines, monitoring Kubernetes pods, and moreGrafana AgentKubernetes
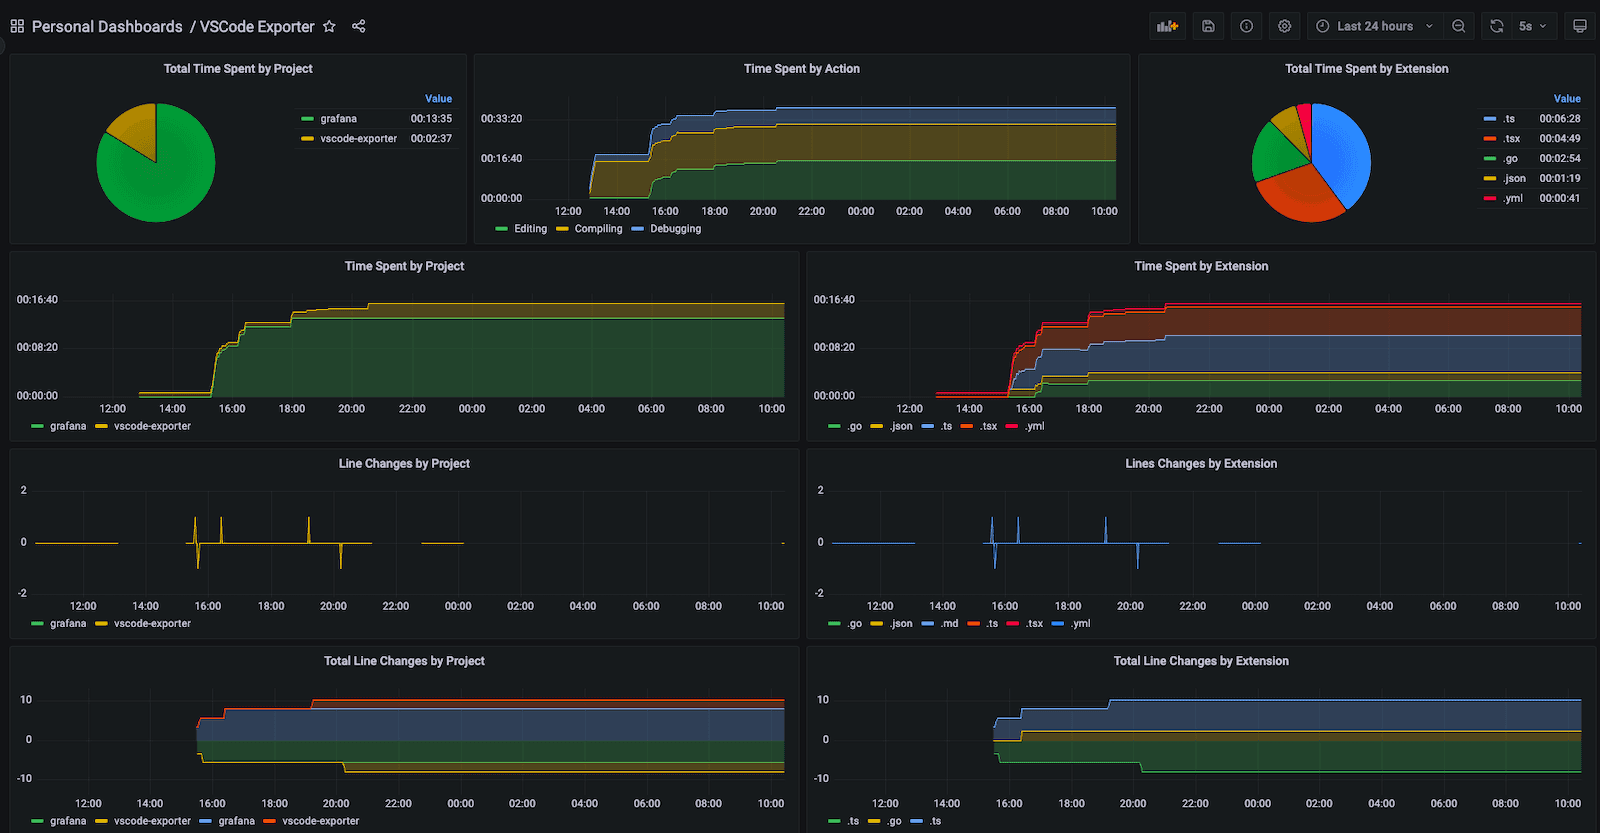
How to track development metrics with VSCode Exporter, Grafana Agent, and Grafana CloudGrafana AgentGrafana CloudPrometheus
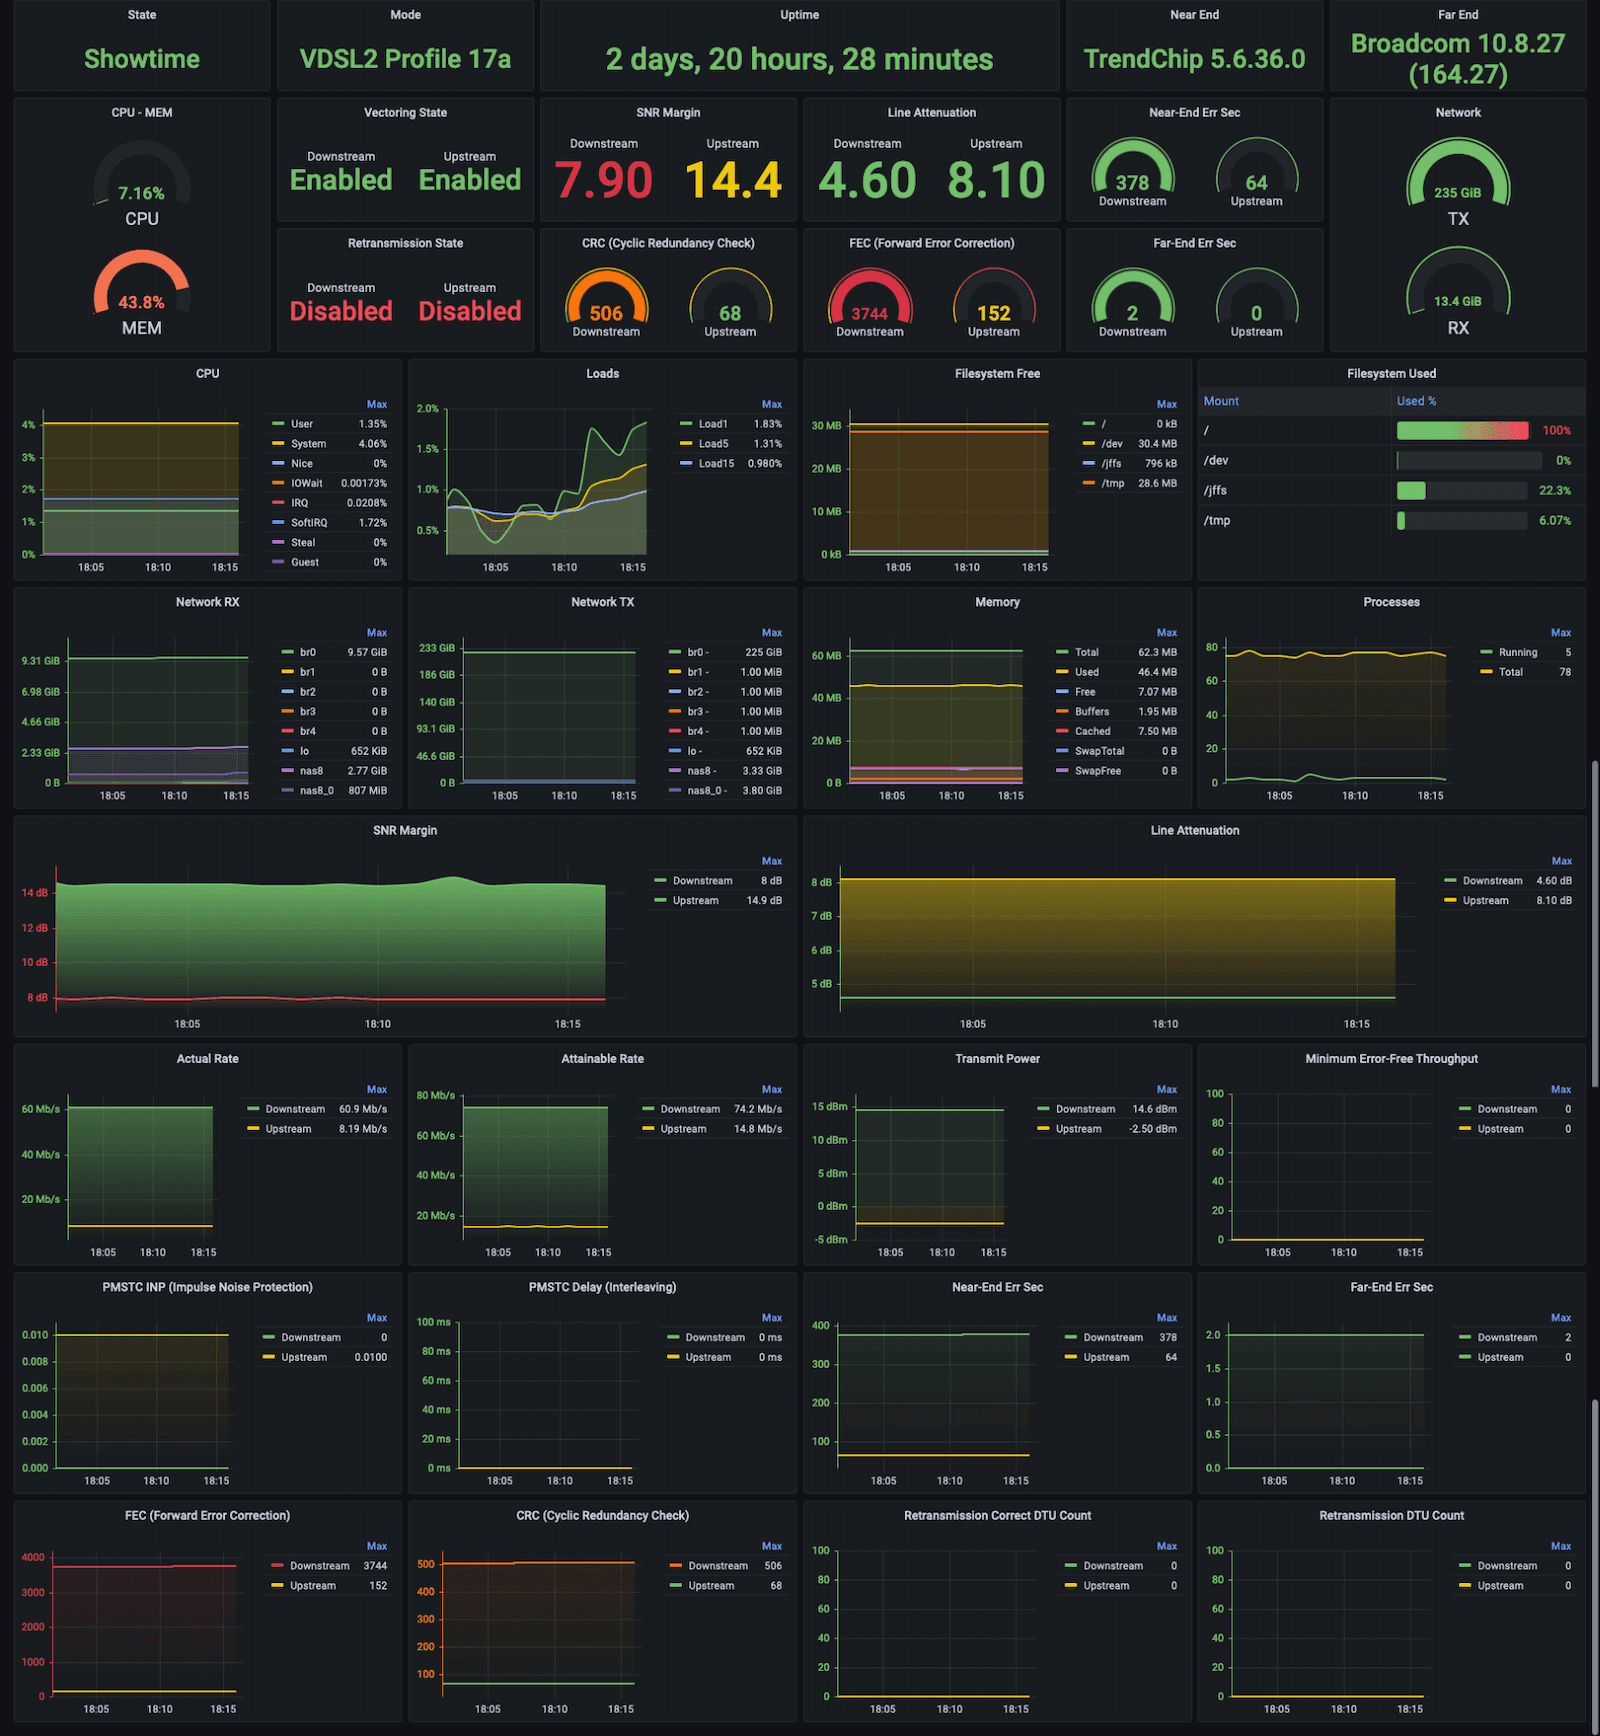
How to monitor an xDSL Modem using a Prometheus Exporter plugin and Grafana Agent on Grafana Cloud with Grafana OnCallPrometheusGrafana AgentGrafana CloudGrafana OnCall
Grafana Agent v0.32 release: New integrations with Oracle, AWS, Microsoft Azure, and moreGrafana AgentRelease
AWS Fargate monitoring: How to collect serverless logs, metrics, and traces in GrafanaAWSGrafana Agent
Grafana Agent v0.31 release: new Helm chart, Flow support for Grafana Phlare, and moreGrafana AgentGrafana Phlare
How to use the Grafana Ansible collection to manage Grafana Agent across multiple Linux hostsGrafana AgentGrafana Cloud
How runners and cyclists can sync Garmin devices to Grafana Cloud to analyze fitness metricsIoTGrafana CloudGrafana AgentLoki
Grafana Agent 0.20.1 and 0.21.2 released with security fixesReleaseSecurityGrafana AgentGrafana CloudGrafana Enterprise Metrics
“Open source done right”: Why Canonical adopted Grafana, Loki, and Grafana Agent for their new stackCommunityGrafanaGrafana AgentLoki