ServiceNow and Grafana: How to receive Grafana alert payloads via ServiceNow’s scripted REST API IntegrationsAlerting
Improve service reliability and ops culture with Grafana Cloud Service Center AlertingSLOsGrafana CloudGrafana Cloud IRM
Adaptive alerting: faster, better insights with the new metrics forecasting UI in Grafana CloudAIGrafana CloudAlerting
How to send alerts from Grafana OSS to Grafana Cloud IRMGrafana Cloud IRMGrafanaGrafana EnterpriseGrafana CloudAlerting
How to import Prometheus-style alerts and recording rules to Grafana-managed alerts and recording rulesAlertingPrometheusGrafana
Creating alerts from panels in Kubernetes Monitoring: an overlooked, powerhouse featureKubernetes MonitoringKubernetesAlerting
Grafana 11.1 release: new visualization features, Grafana Alerting updates, and moreGrafanaVisualizationAlerting
Grafana Alerting: new tools to resolve incidents faster and avoid alert fatigueAlertingGrafanaGrafana OnCallGrafana Cloud IRM
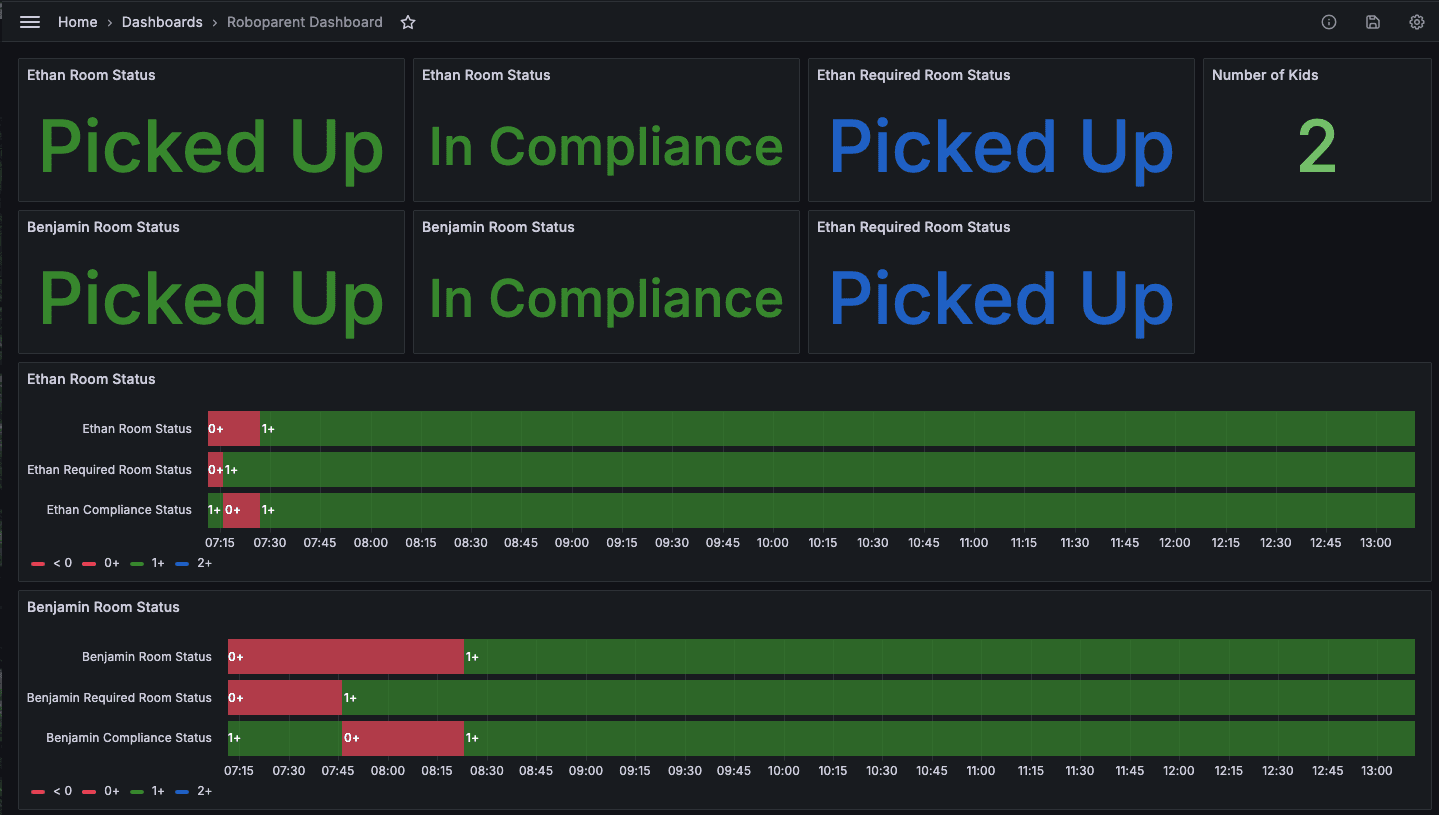
How to monitor your kids’ chores: An introduction to Grafana-powered parentingAlertingGrafana CloudDashboard
A better Grafana OnCall: Seamless workflows with the rest of Grafana CloudGrafana OnCallSiftAlertingIncident Response & Management
Grafana 10.4 release: Grafana Alerting improvements, visualization updates, new plugin, and moreEngineeringGrafanaPluginsAlerting
Kubernetes alerting: Simplify anomaly detection in Kubernetes clusters with Grafana CloudKubernetes MonitoringKubernetesAlerting
Grafana 10.3 release: Canvas panel updates, multi-stack data sources, and moreGrafanaGrafana EnterpriseAlertingOpen Source
Easily page participants to accelerate incident response in Grafana IRMAlertingGrafana IncidentGrafana CloudGrafana OnCall