How to send alerts from Grafana OSS to Grafana Cloud IRMGrafana Cloud IRMGrafanaGrafana EnterpriseGrafana CloudAlerting
Introducing SCIM provisioning in Grafana: Enterprise-grade user management made simpleGrafanaGrafana EnterpriseGrafana CloudSecurity
From multi-line queries to no-code investigations: meeting Grafana users where they areGrafana EnterpriseGrafana CloudGrafanaDrilldown
Visualize Atlassian Statuspage, Cloudflare, and Netlify data: what’s new in Grafana Enterprise data source pluginsPluginsGrafana CloudGrafana Enterprise
Grafana access management: How to use teams for seamless user and permission managementGrafanaGrafana CloudGrafana Enterprise
Visualize Catchpoint, PagerDuty, and Amazon DynamoDB data: what’s new in Grafana Enterprise data source pluginsPluginsGrafana CloudGrafana Enterprise
Empowering every user: How Schwarz IT harnesses Grafana Enterprise for their diverse observability needsGrafanaGrafana EnterpriseCommunity
Upgrade with confidence: Strategies for updating your self-hosted Grafana instanceGrafana EnterpriseOpen SourceGrafana
Grafana Enterprise data source plugins: A brief guide to what they are and how to get startedPluginsGrafana EnterpriseGrafana Cloud
Grafana 10.3 release: Canvas panel updates, multi-stack data sources, and moreGrafanaGrafana EnterpriseAlertingOpen Source
Grafana 10.2 release: Grafana panel title generator, interactive visualizations, and moreGrafanaGrafana CloudGrafana EnterpriseRelease
New Grafana releases to support transition to Azure AD Workload Identity authentication in Microsoft AzureGrafanaGrafana Enterprise
Grafana and Grafana Enterprise updates for ARMv6 and ARMv7 will be temporarily pausedGrafanaGrafana Enterprise
New in Grafana 10: A UI to easily configure SAML authenticationSecurityGrafana CloudGrafana Enterprise
How Worldline uses Grafana Enterprise and Grafana Mimir to run its platform-as-a-service at a global scaleMimirGrafana Enterprise
Reduce MTTR and improve UX with Grafana Enterprise: Inside Optum’s observability stackCommunityGrafana Enterprise
How Denmark’s Energinet uses Grafana Enterprise to monitor underwater energy cables — and do detective workGrafana EnterpriseGrafana
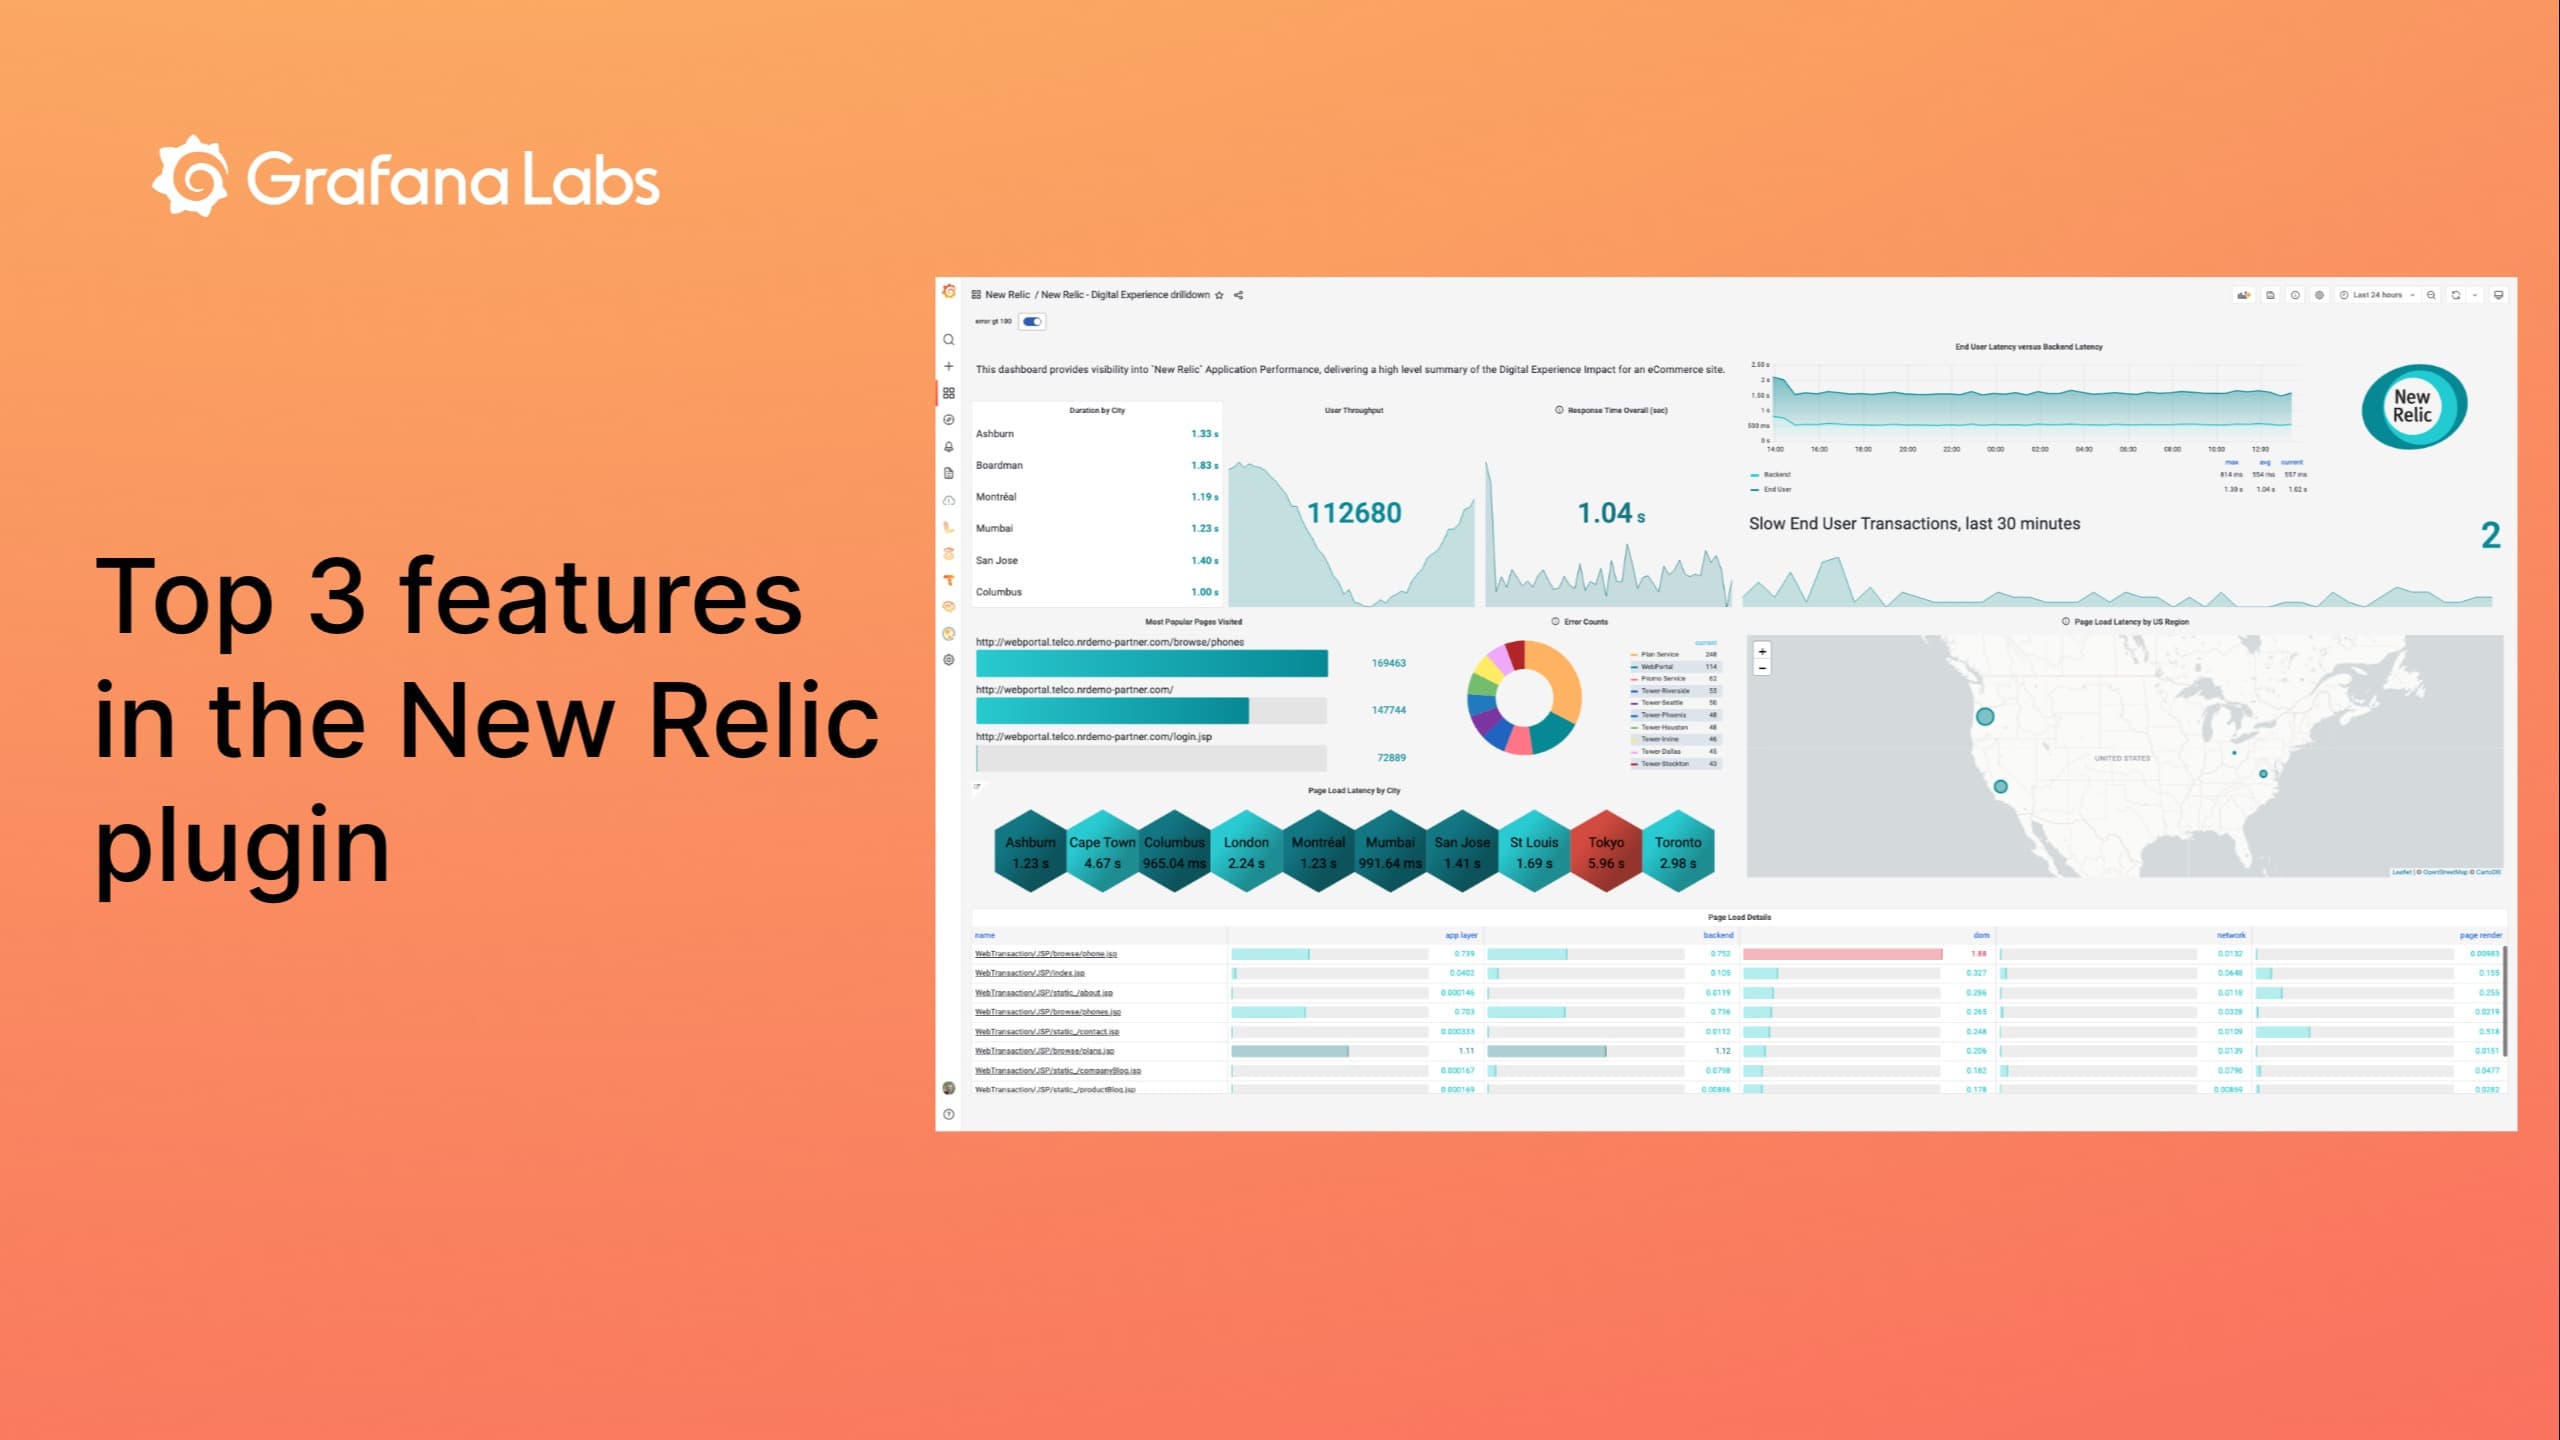
Video: Top 3 features of the New Relic data source plugin for Grafana EnterprisePluginsGrafana EnterpriseGrafana CloudDashboard