Snowflake data visualization: all the latest features to monitor metrics, enhance security, and morePluginsVisualization
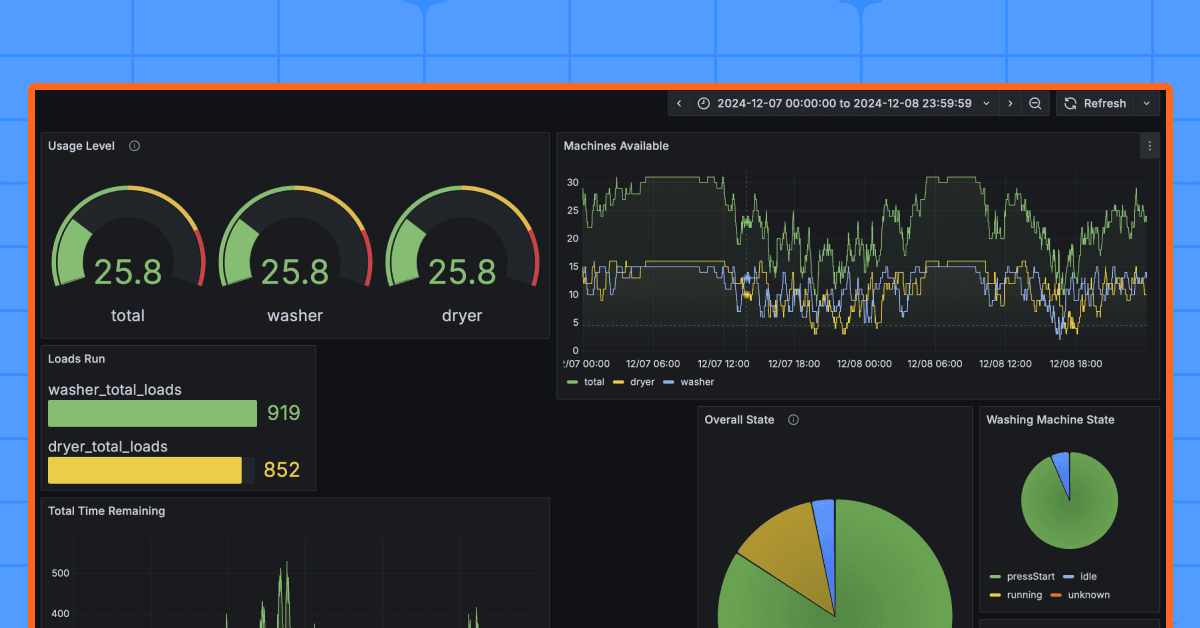
Dashboards and detergent: How two students monitor laundry machines in a college dorm with GrafanaGrafanaVisualizationCommunity
Visualize Google Sheets data: how to turn your spreadsheets into Grafana dashboardsPluginsVisualizationGrafana
Data sources, visualizations, and apps: A guide to extending and customizing GrafanaPluginsVisualizationGrafana
How to work with multiple data sources in Grafana dashboards: best practices to get startedGrafanaDashboardVisualization
Grafana 11.1 release: new visualization features, Grafana Alerting updates, and moreGrafanaVisualizationAlerting
Canvas panel in Grafana: create custom visualizations with all the latest featuresGrafanaVisualization