Plugins 〉SPC Characteristic


SPC Characteristic
SPC Characteristic Datasource
The SPC Characteristic Datasource connects your measurement database to the SPC CAD Panel, powering its feature annotations, control charts, capability indices, and trend forecasts — no SQL required.

Why SPC Characteristic Datasource?
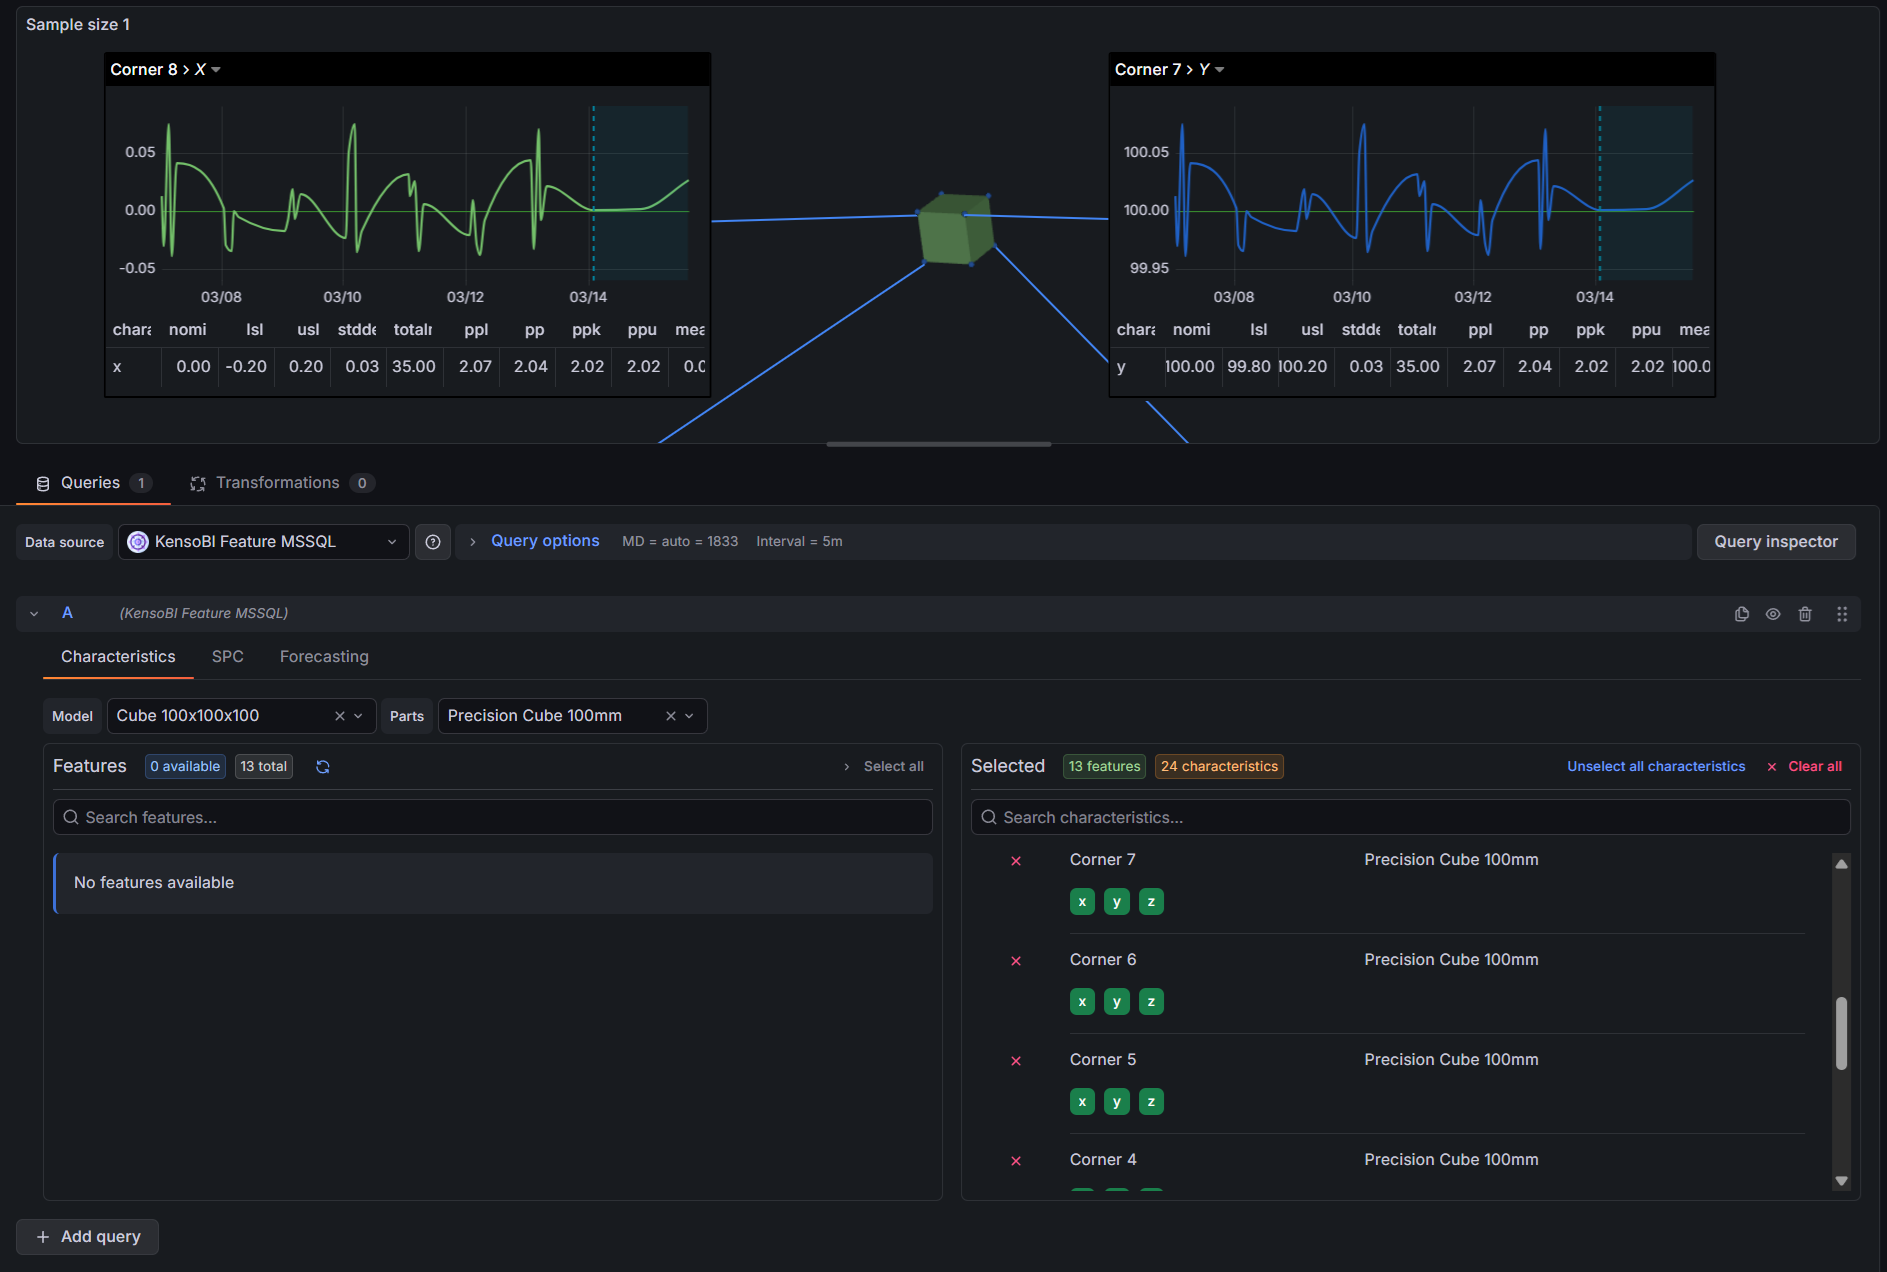
The SPC CAD Panel displays CAD models in 3D with clickable feature annotations showing measurement data, trend charts, and process statistics. This datasource is what feeds it. It connects to your measurement database, lets you select which features and characteristics to query through a point-and-click interface, and returns everything the CAD panel needs in a single query:
- Static SPC statistics — mean, control limits, Cp/Cpk, Pp/Ppk, and more per characteristic, ready to display in annotation tables
- Time series measurements — individual measurements over time for embedded trend charts inside annotations
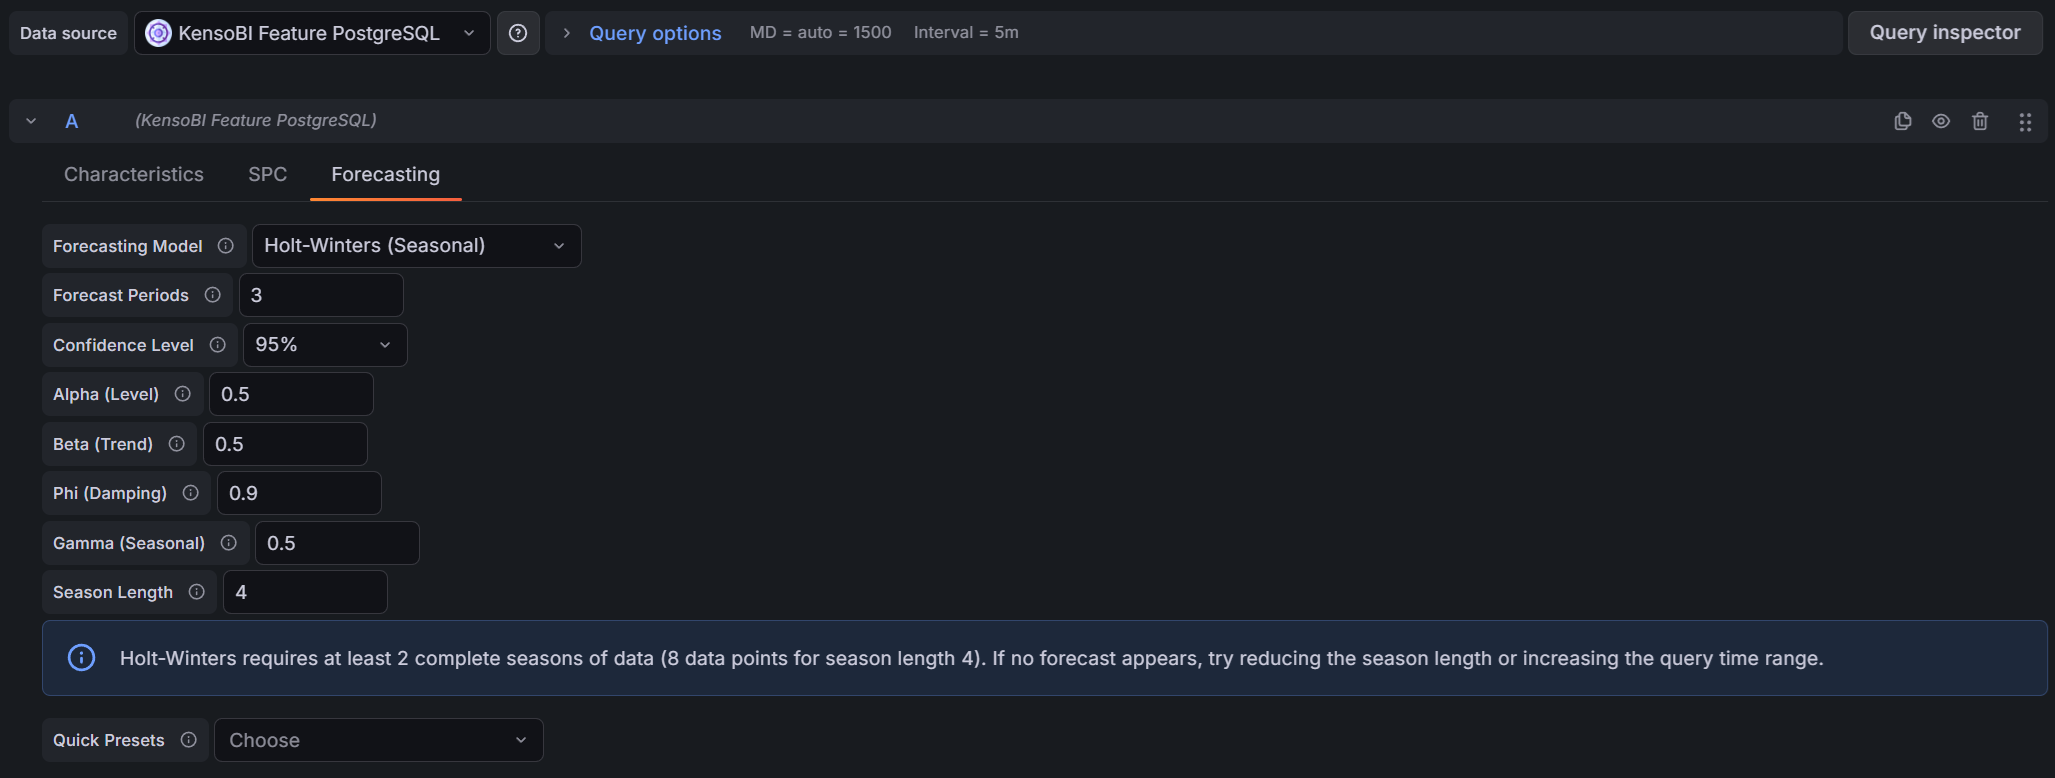
- Forecast data — predicted future values with confidence bands, rendered as forecast lines in annotation charts
Features

| Feature | Description |
|---|---|
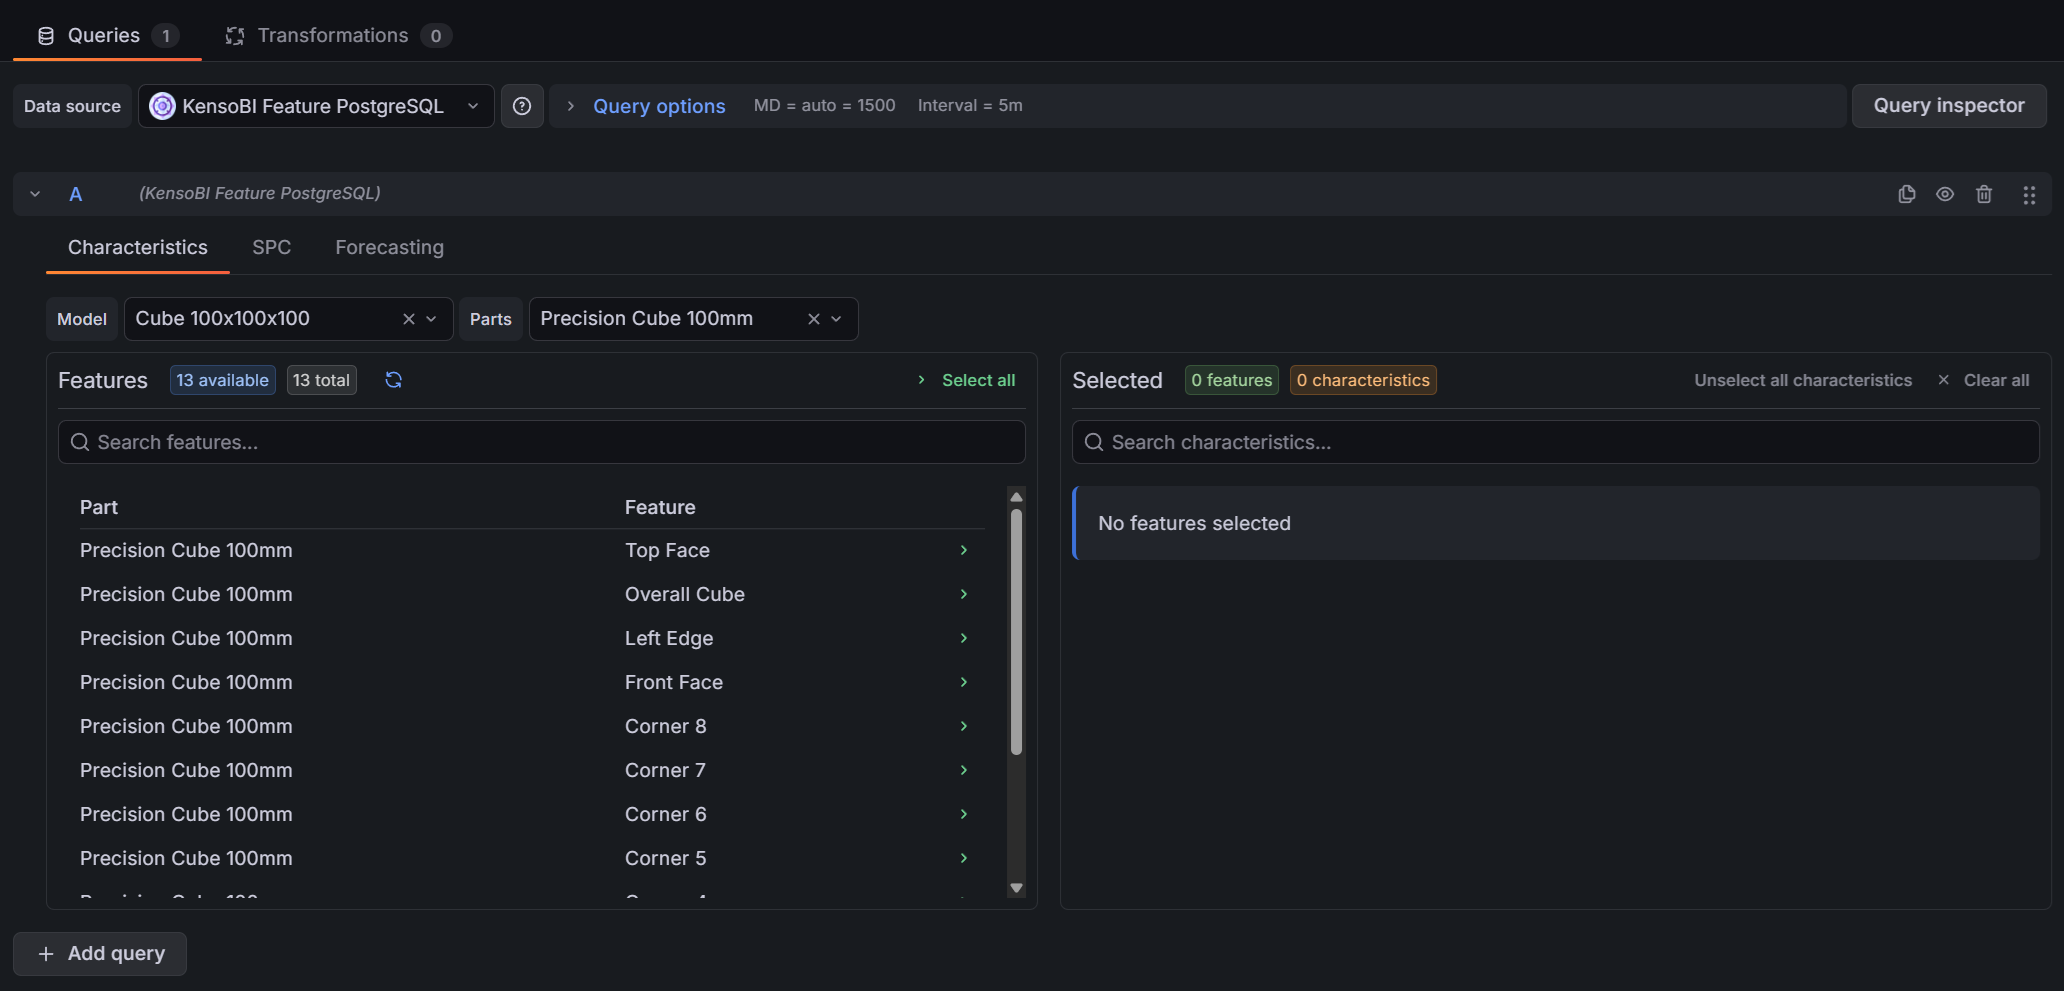
| Visual feature selector | Browse and select features and characteristics by model and part — no SQL needed |
| Cascading filters | Selecting a model narrows the parts list; selecting a part narrows the features list |
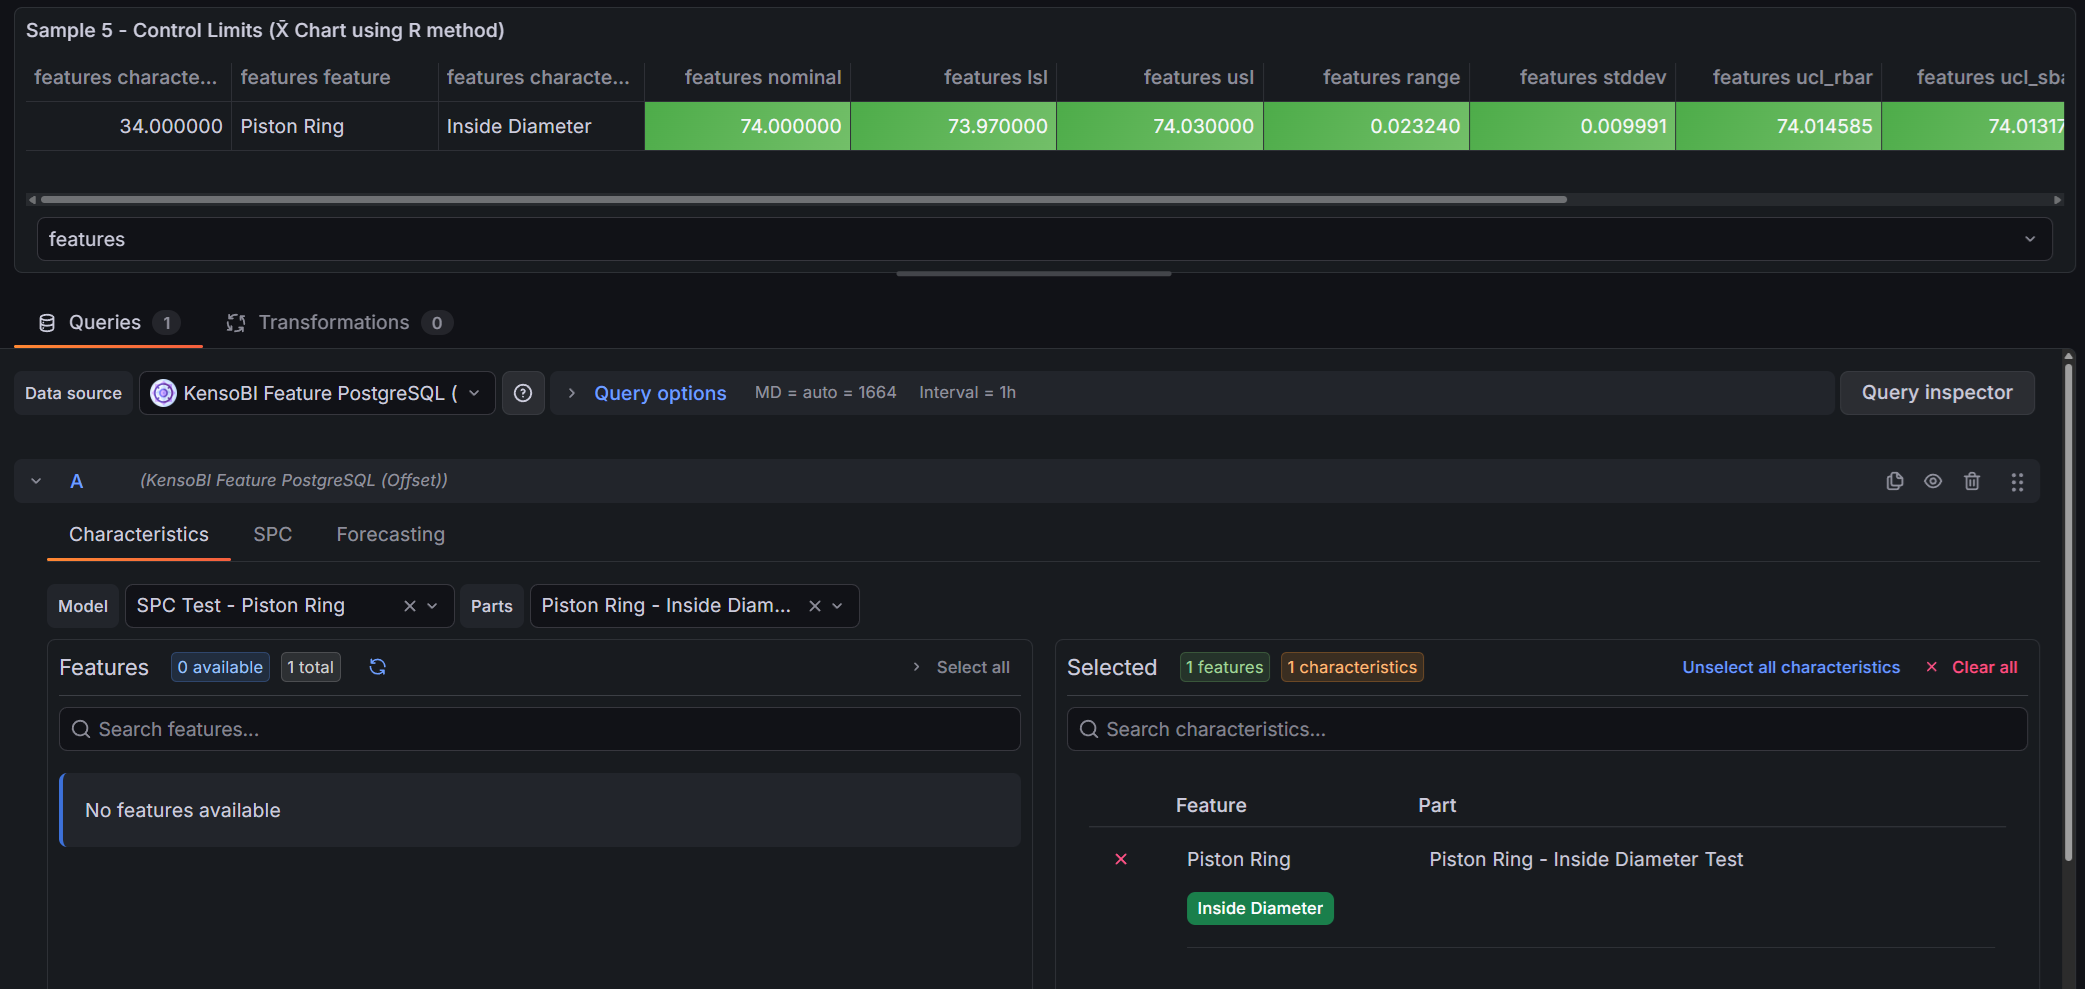
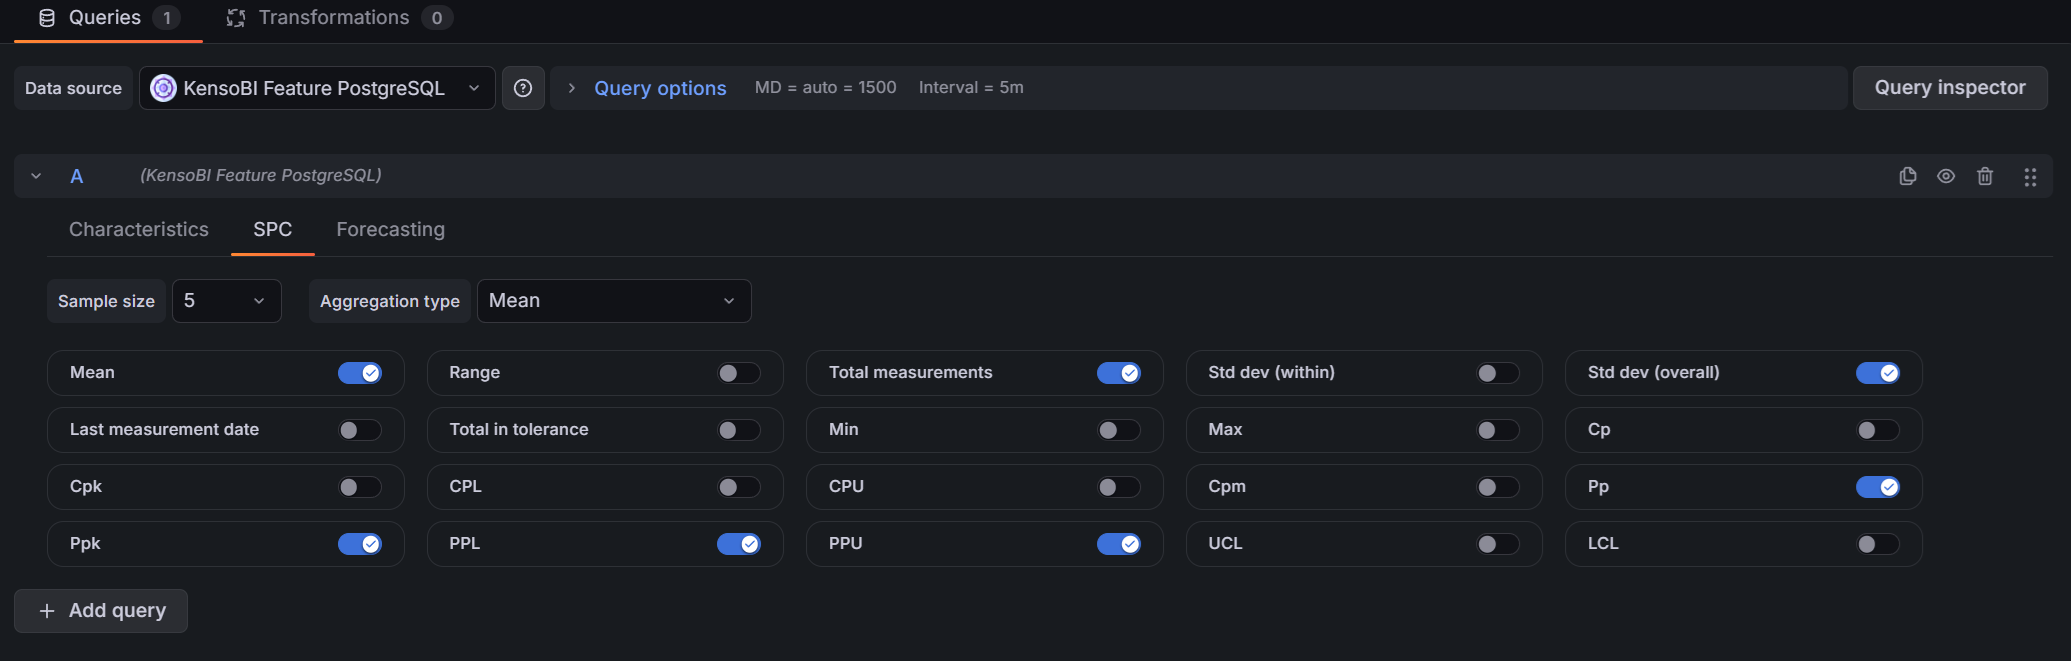
| SPC statistics | Mean, UCL/LCL, Cp, Cpk, Pp, Ppk, std dev, min, max, total in tolerance, and more |
| Built-in forecasting | Moving Average, Linear Regression, Holt, and Holt-Winters — runs in the browser, no external service |
| Confidence bands | Upper and lower prediction intervals at 80%, 90%, 95%, or 99% confidence |
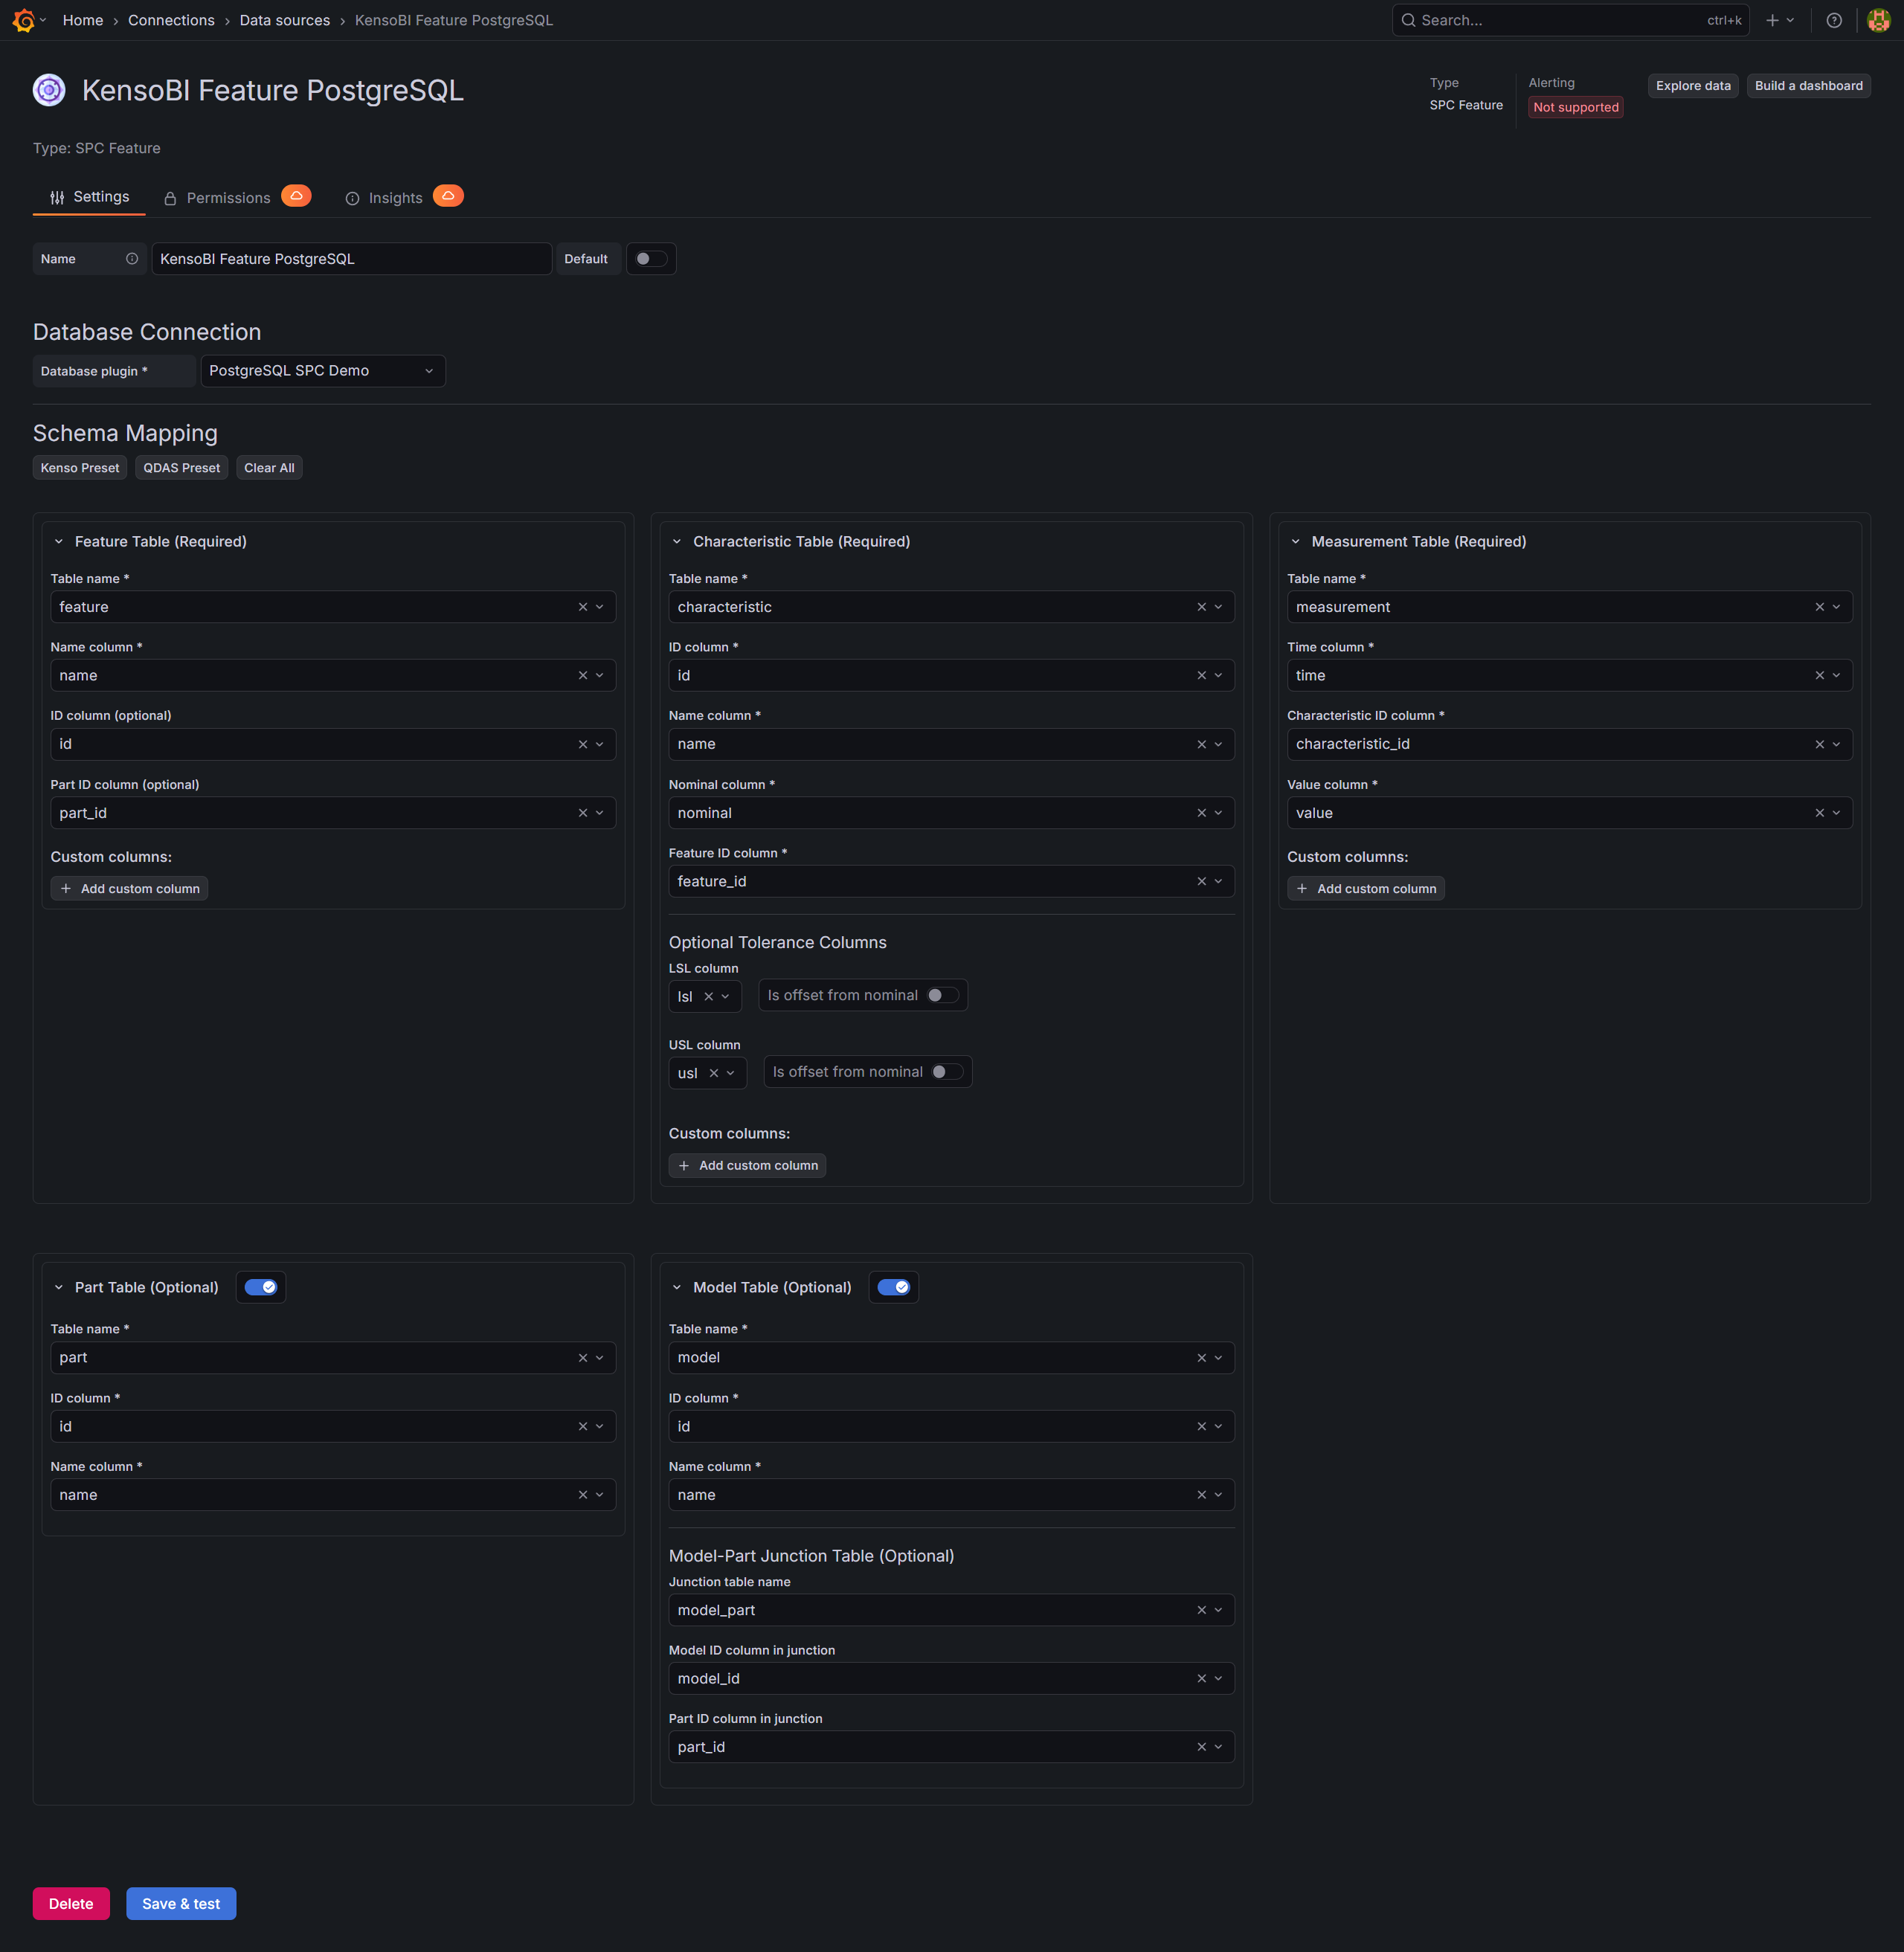
| Schema presets | One-click setup for KensoBI and Q-DAS database schemas |
| Custom schema mapping | Map any database structure with table and column pickers |
| PostgreSQL and MSSQL | Works with existing Grafana SQL datasource |
Requirements
- Grafana 11.6.10 or later
- A configured Grafana PostgreSQL or MSSQL datasource pointing to your measurement database
Getting Started
- Install the plugin from the Grafana Plugin Catalog.
- In Grafana, go to Administration → Data sources → Add new data source and search for SPC Characteristic.
- Select your existing PostgreSQL or MSSQL datasource under Database Connection.
- Click Kenso Preset or QDAS Preset to auto-fill the schema, or configure table and column mappings manually.
- Click Save & test, then open an SPC CAD panel, select SPC Characteristic as the data source, and start building queries.
For detailed documentation, configuration guides, and examples, see the full documentation.
Part of the KensoBI SPC Suite
SPC Characteristic Datasource is part of a growing family of Statistical Process Control plugins for Grafana by Kenso Software:
SPC CAD Panel — displays CAD models in 3D with interactive feature annotations driven by this datasource. See measurement statistics, trend charts, and forecasts directly on your part geometry.
SPC Chart Panel — control charts (XmR, Xbar-R, Xbar-S) for monitoring process stability over time.
SPC Histogram Panel — distribution analysis with histograms, bell curves, and a statistics table showing Cp, Cpk, Pp, and Ppk.
SPC Box Plot Panel — box-and-whisker plots with Xf-Rf resistant control limits.
SPC Bullet Panel — compact bullet charts and progress bars with optional SPC metrics (Cpk, Cp, Ppk, Pp, Sigma Level) for dense KPI dashboards.
SPC Pareto Panel — Pareto charts for identifying the vital few defect sources.
License
This software is distributed under the Kenso Software Commercial License. Use requires a valid commercial license. No open-source rights are granted.
Support
- Contact support at https://kensobi.com/contact
- KensoBI Discord
Grafana Cloud Free
- Free tier: Limited to 3 users
- Paid plans: $55 / user / month above included usage
- Access to all Enterprise Plugins
- Fully managed service (not available to self-manage)
Self-hosted Grafana Enterprise
- Access to all Enterprise plugins
- All Grafana Enterprise features
- Self-manage on your own infrastructure
Install on Grafana Cloud
Plugins can be installed directly from within your Grafana instance or automated using the Cloud API or Terraform.
Learn more about plugin installationMarketplace plugins
This is a paid plugin developed by a marketplace partner. To purchase an entitlement, sign in first, then fill out the contact form.
Get this plugin
This is a paid for plugin developed by a marketplace partner. To purchase entitlement please fill out the contact us form.
What to expect:
- Grafana Labs will reach out to discuss your needs
- Payment will be taken by Grafana Labs
- Once purchased the plugin will be available for you to install (cloud) or a signed version will be provided (on-premise)
Thank you! We will be in touch.
For more information, visit the docs on plugin installation.
Installing on a local Grafana:
For local instances, plugins are installed and updated via a simple CLI command. Plugins are not updated automatically, however you will be notified when updates are available right within your Grafana.
1. Install the Data Source
Use the grafana-cli tool to install SPC Characteristic from the commandline:
grafana-cli plugins install The plugin will be installed into your grafana plugins directory; the default is /var/lib/grafana/plugins. More information on the cli tool.
Alternatively, you can manually download the .zip file for your architecture below and unpack it into your grafana plugins directory.
Alternatively, you can manually download the .zip file and unpack it into your grafana plugins directory.
2. Configure the Data Source
Accessed from the Grafana main menu, newly installed data sources can be added immediately within the Data Sources section.
Next, click the Add data source button in the upper right. The data source will be available for selection in the Type select box.
To see a list of installed data sources, click the Plugins item in the main menu. Both core data sources and installed data sources will appear.
Changelog
2.0.0
Major refactor.