
Plugins 〉SPC Histogram
SPC Histogram
SPC Histogram
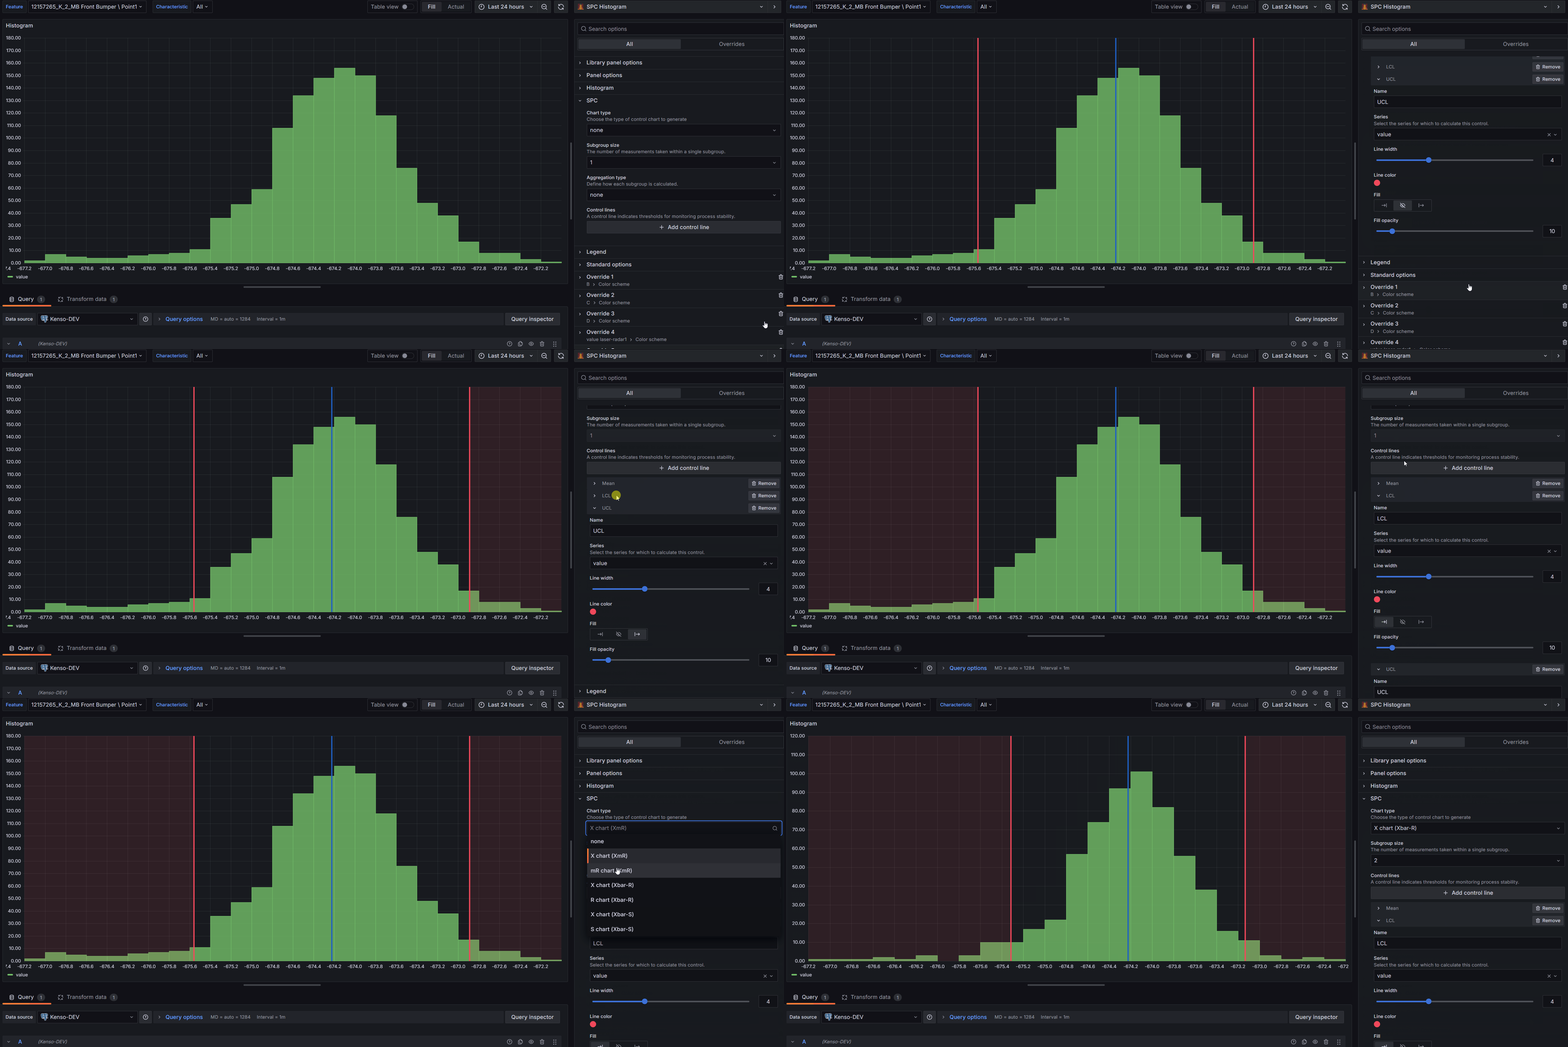
Visualize your process data distributions with built-in Statistical Process Control — right inside Grafana. SPC Histogram turns your time series data into interactive histograms with automatic control limits, bell curves, capability indices, and a detailed statistics table.
Why SPC Histogram?
Histograms are a fundamental tool for understanding process data. When combined with Statistical Process Control, they answer the key questions about your process:
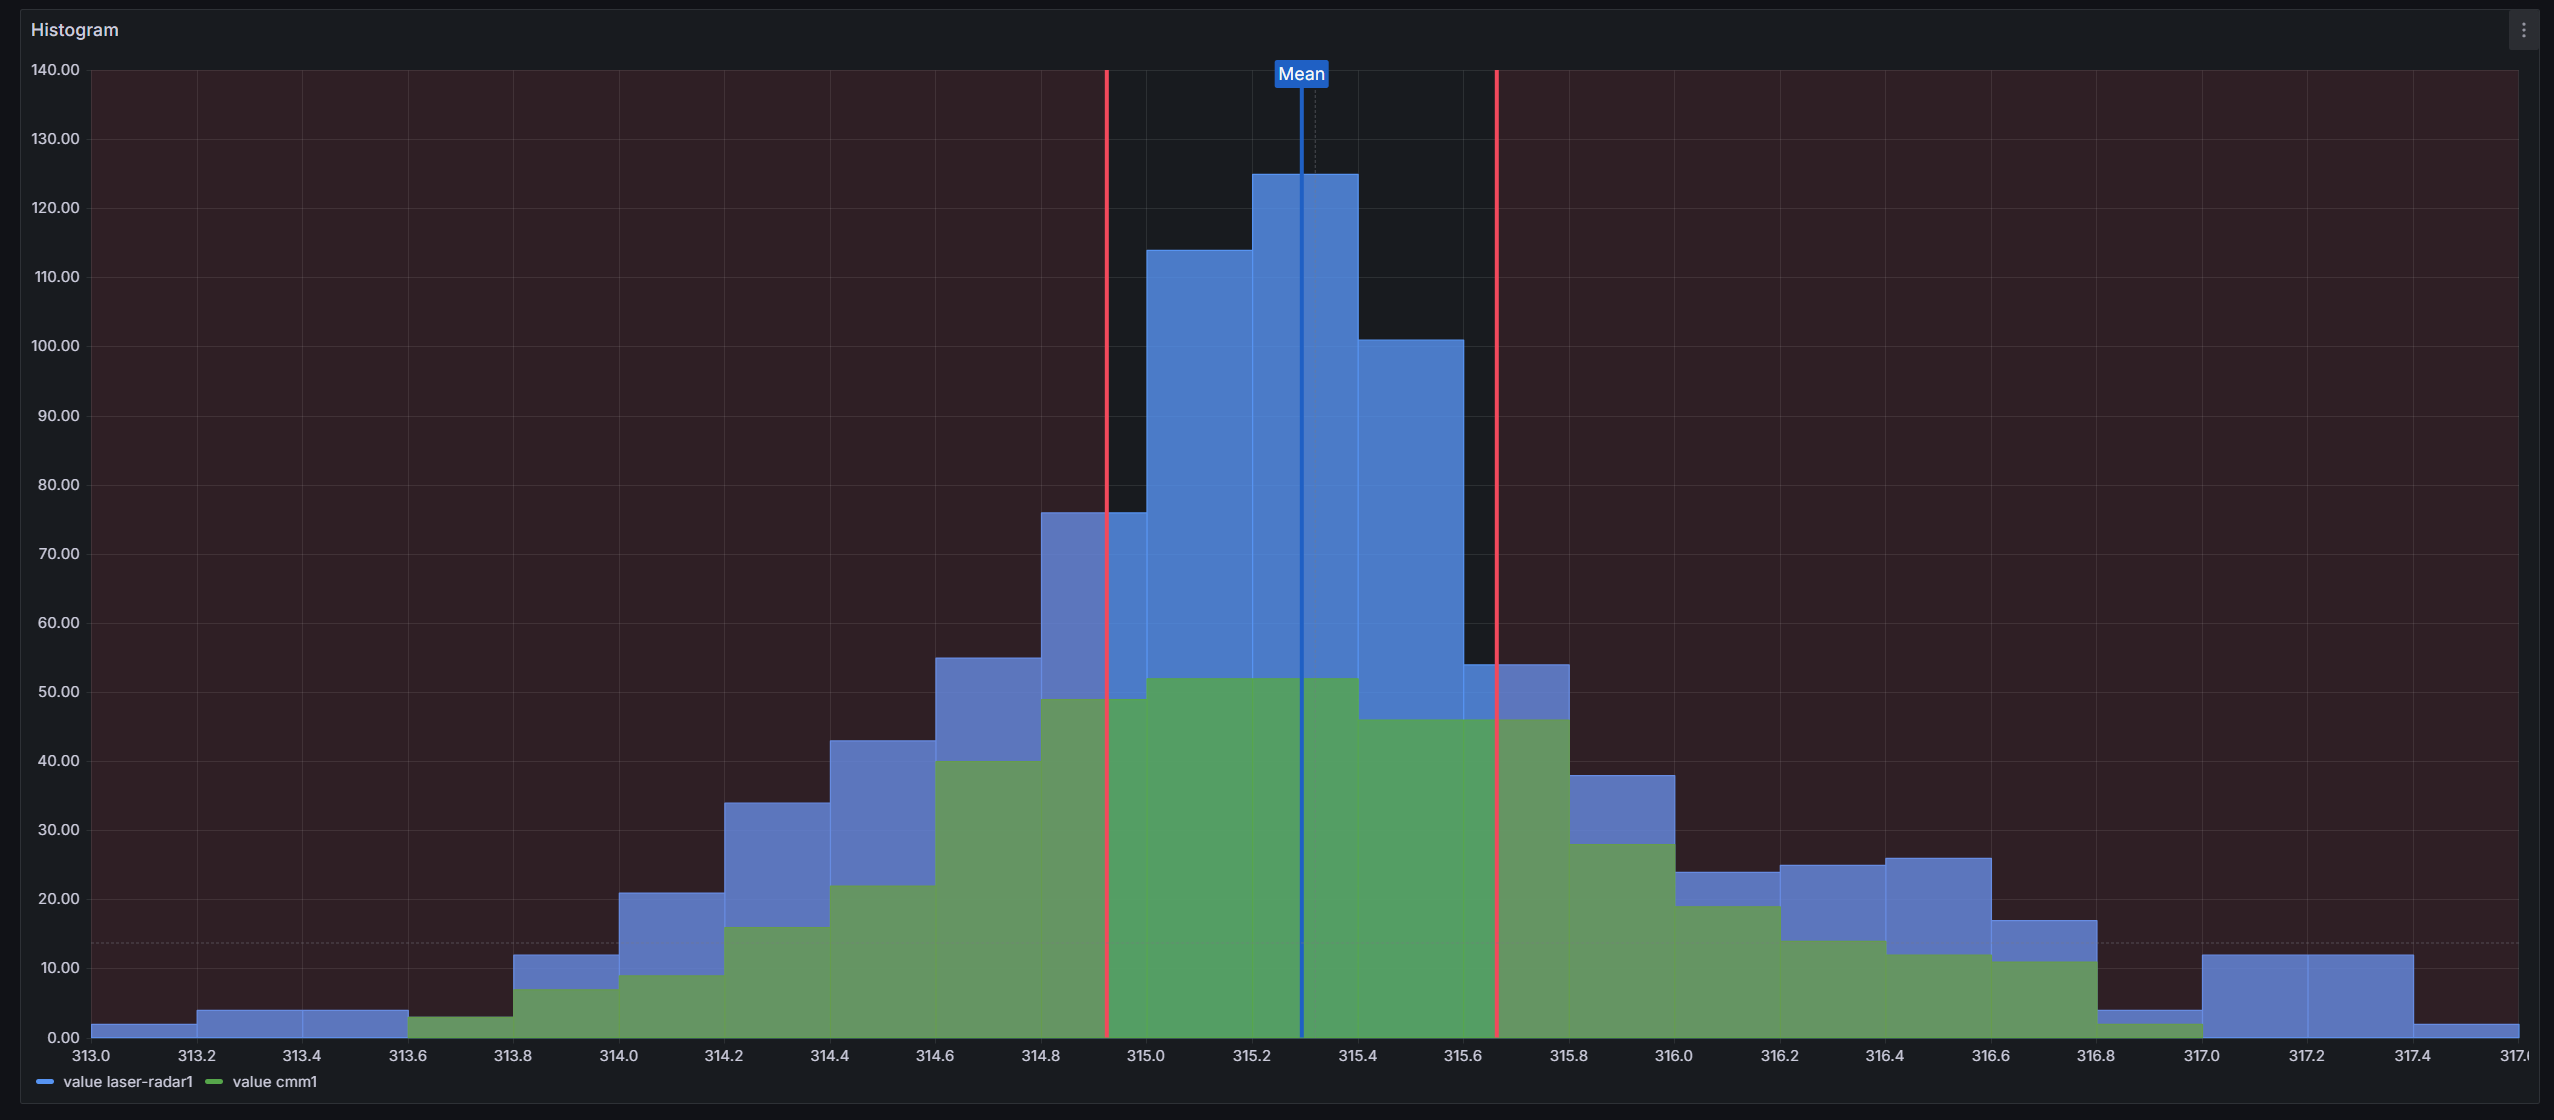
- Control limits — automatically calculated LCL/UCL lines show whether variation is within expected bounds
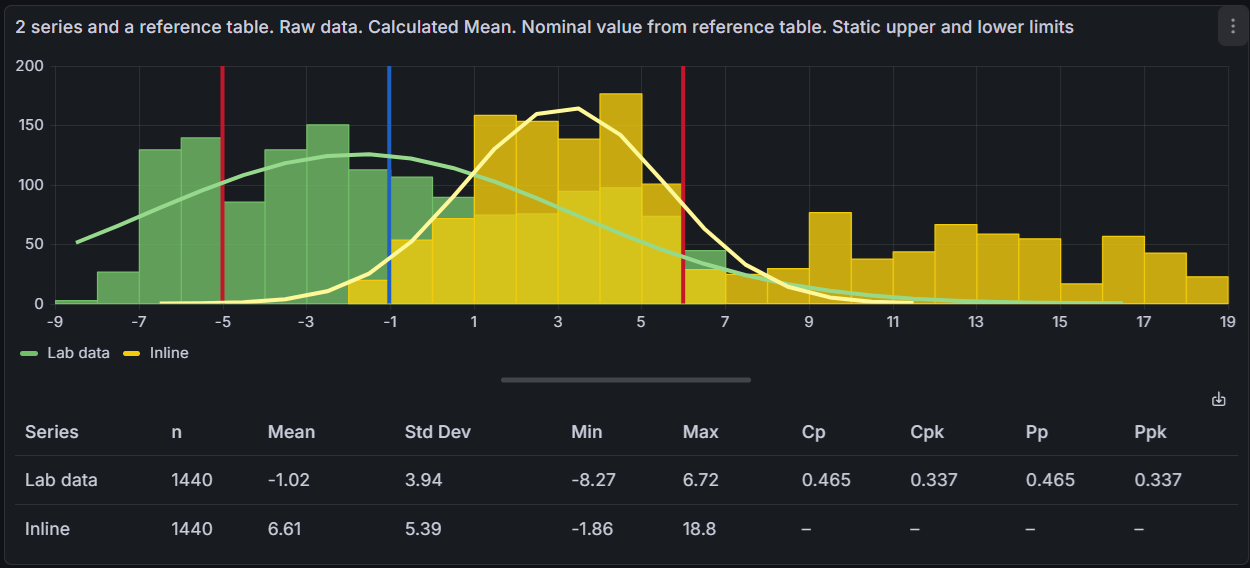
- Capability indices — Cp, Cpk, Pp, and Ppk tell you whether your process fits within specification limits
- Bell curves — Gaussian curves fitted using the Levenberg-Marquardt algorithm reveal how closely your data follows a normal distribution
- Statistics at a glance — a built-in table displays n, Mean, Std Dev, Min, Max, and more for every series

Built for Grafana
SPC Histogram is built using Grafana's native visualization components. This means it inherits the look, feel, and behavior you already know:
- Native theming — automatically adapts to light and dark mode
- Standard panel options — legend placement, tooltip behavior, and field overrides work just like any other Grafana panel
- Resizable statistics table — drag the splitter to balance chart and table space, just like Grafana's built-in panels
- Works with any data source — use it with SQL databases, Prometheus, InfluxDB, CSV files, or any other Grafana data source
Features
| Feature | Description |
|---|---|
| Control charts | XmR, Xbar-R, and Xbar-S chart types with automatic LCL/UCL calculation |
| Bell curves | Gaussian (Levenberg-Marquardt fit) and histogram curve overlays |
| Statistics table | n, Mean, Std Dev, Min, Max, LCL, UCL, Cp, Cpk, Pp, Ppk per series |
| Custom control lines | Static values or dynamic values pulled from a separate query |
| Specification limits | LSL/USL with automatic capability index calculation |
| Multiple series | Compare distributions side by side or combine into one histogram |
| Aggregation | Mean, Range, Standard Deviation, and Moving Range modes |
| Export to CSV | Export statistics, control lines, and histogram buckets to CSV |
| Interactive tooltips | Bucket counts, control line values, and Gaussian curve values on hover |
| Resizable layout | Drag the splitter between chart and statistics table |
Use Cases
- Manufacturing quality — monitor dimensional tolerances with control limits and capability indices
- Process engineering — track measurement stability and detect shifts in process centering
- Laboratory testing — analyze instrument measurement distributions and repeatability
- Supply chain — monitor incoming material quality against specification limits
- Pharmaceutical — validate process capability for batch manufacturing (Cp/Cpk)
Requirements
- Grafana 11 or later
Getting Started
- Install the plugin from the Grafana Plugin Catalog
- Add a new panel and select SPC Histogram as the visualization
- Connect a data source with time series data
- Choose a Chart Type (XmR, Xbar-R, or Xbar-S) to enable automatic control limits
- Add Control Lines for specification limits (LSL/USL) to see capability indices
- Add a Bell Curve to visualize the distribution fit
Panel Options
Histogram
| Option | Description | Default |
|---|---|---|
| Bucket count | Approximate number of histogram bars | 30 |
| Bucket size | Fixed width for each bucket (overrides bucket count) | Auto |
| Bucket offset | Shifts bucket boundaries by a fixed amount | 0 |
| Combine series | Merge all series into a single histogram | Off |
| Feature Queries | Select queries excluded from histogram calculations | None |
SPC
| Option | Description | Default |
|---|---|---|
| Chart type | none, X chart (XmR), mR chart (XmR), X chart (Xbar-R), R chart (Xbar-R), X chart (Xbar-S), S chart (Xbar-S) | none |
| Subgroup size | Number of measurements per subgroup | 1 |
| Aggregation type | None, Moving range, Mean, Range, Standard Deviation. Only available when chart type is "none". | None |
| Control lines | LCL, UCL, Mean, Min, Max, Range, LSL, USL, Gaussian Peak, Custom, Nominal | None |
Curve
| Option | Description | Default |
|---|---|---|
| Add a Bell Curve | Gaussian or Histogram curve with configurable series, line width, and color | None |
Statistics Table
| Option | Description | Default |
|---|---|---|
| Show statistics table | Display the statistics table below the histogram | Off |
| Visible columns | n, Mean, Std Dev, Min, Max, LCL, UCL, Cp, Cpk, Pp, Ppk | All |
Bar Appearance
| Option | Description | Default |
|---|---|---|
| Fill opacity | Bar fill opacity (0–100%) | 80% |
| Line width | Bar border width (0–10) | 1 |
| Gradient mode | None, Opacity, or Hue | None |
Documentation
For detailed documentation, configuration guides, and examples, see the full documentation.
Part of the KensoBI SPC Suite
SPC Histogram is part of a growing family of Statistical Process Control plugins for Grafana by Kenso Software:
SPC Chart Panel — Control charts for monitoring process stability over time. Supports Xbar-R, Xbar-S, and XmR charts with automatic calculation of control limits. If you're tracking whether a process is staying in control, this is your starting point.
SPC Pareto Panel — Pareto charts for identifying the most significant factors contributing to defects or issues. Automatic sorting, cumulative percentage lines, and 80/20 threshold analysis help you focus improvement efforts where they matter most.
SPC CAD Panel — Brings 3D geometry into the picture, letting you bind the data from control charts and histograms to physical features on your parts.
License
This software is distributed under the AGPL-3.0-only license — see LICENSE for details.
Support
If you have any questions or feedback, you can:
- Ask a question on the KensoBI Discord channel.
- GitHub Issues: https://github.com/KensoBI/spc-histogram/issues
Grafana Cloud Free
- Free tier: Limited to 3 users
- Paid plans: $55 / user / month above included usage
- Access to all Enterprise Plugins
- Fully managed service (not available to self-manage)
Self-hosted Grafana Enterprise
- Access to all Enterprise plugins
- All Grafana Enterprise features
- Self-manage on your own infrastructure
Grafana Cloud Free
- Free tier: Limited to 3 users
- Paid plans: $55 / user / month above included usage
- Access to all Enterprise Plugins
- Fully managed service (not available to self-manage)
Self-hosted Grafana Enterprise
- Access to all Enterprise plugins
- All Grafana Enterprise features
- Self-manage on your own infrastructure
Grafana Cloud Free
- Free tier: Limited to 3 users
- Paid plans: $55 / user / month above included usage
- Access to all Enterprise Plugins
- Fully managed service (not available to self-manage)
Self-hosted Grafana Enterprise
- Access to all Enterprise plugins
- All Grafana Enterprise features
- Self-manage on your own infrastructure
Grafana Cloud Free
- Free tier: Limited to 3 users
- Paid plans: $55 / user / month above included usage
- Access to all Enterprise Plugins
- Fully managed service (not available to self-manage)
Self-hosted Grafana Enterprise
- Access to all Enterprise plugins
- All Grafana Enterprise features
- Self-manage on your own infrastructure
Grafana Cloud Free
- Free tier: Limited to 3 users
- Paid plans: $55 / user / month above included usage
- Access to all Enterprise Plugins
- Fully managed service (not available to self-manage)
Self-hosted Grafana Enterprise
- Access to all Enterprise plugins
- All Grafana Enterprise features
- Self-manage on your own infrastructure
Install on Grafana Cloud
Plugins can be installed directly from within your Grafana instance or automated using the Cloud API or Terraform.
Learn more about plugin installationMarketplace plugins
This is a paid plugin developed by a marketplace partner. To purchase an entitlement, sign in first, then fill out the contact form.
Get this plugin
This is a paid for plugin developed by a marketplace partner. To purchase entitlement please fill out the contact us form.
What to expect:
- Grafana Labs will reach out to discuss your needs
- Payment will be taken by Grafana Labs
- Once purchased the plugin will be available for you to install (cloud) or a signed version will be provided (on-premise)
Thank you! We will be in touch.
For more information, visit the docs on plugin installation.
Installing on a local Grafana:
For local instances, plugins are installed and updated via a simple CLI command. Plugins are not updated automatically, however you will be notified when updates are available right within your Grafana.
1. Install the Panel
Use the grafana-cli tool to install SPC Histogram from the commandline:
grafana-cli plugins install The plugin will be installed into your grafana plugins directory; the default is /var/lib/grafana/plugins. More information on the cli tool.
Alternatively, you can manually download the .zip file for your architecture below and unpack it into your grafana plugins directory.
Alternatively, you can manually download the .zip file and unpack it into your grafana plugins directory.
2. Add the Panel to a Dashboard
Installed panels are available immediately in the Dashboards section in your Grafana main menu, and can be added like any other core panel in Grafana.
To see a list of installed panels, click the Plugins item in the main menu. Both core panels and installed panels will appear.
Changelog
1.5.2
Bug Fixes
- Correct statistics when one query returns several frames: A query can return multiple data frames that share a refId but hold different measurements (for example a Prometheus query with several label sets, or a datasource that splits series by timestamp). The statistics table matched raw data and spec limits by refId, so every such frame reused the first frame's values — showing wrong n, Mean, Std Dev, Min, Max and capability indices. Each frame is now matched to its own data by position, keeping frames with a shared refId distinct.
- Gaussian curve fits data on any measurement scale: The Levenberg-Marquardt fit used a fixed gradient step of 0.1, so for data measured in small units (for example 0.005 ± 0.0005 mm) the fit never moved off its initial guess and the drawn bell did not match the data. Gradient steps now scale with each fitted parameter, and the fit converges to the correct amplitude, mean and sigma regardless of the measurement scale.
- Smooth Gaussian curve with an exact peak: The fitted curve was only evaluated at histogram bin centers, drawing an angular line whose peak was clipped whenever the true mean fell between two bins. The curve is now sampled at 200 points concentrated on the bell itself (mean ± 5 sigma), so it stays smooth and full-height even when coarse bins are used or several frames widen the histogram range.
- Gaussian fit uses the right series with multiple frames and wide queries: Initial fit parameters were estimated from raw values pooled across all value columns of a frame, which targeted the wrong data when a query returned several frames or several value columns. They are now derived from the histogram of the selected series itself, which also makes the fit work for pre-binned histogram queries.
- Histogram-fit curves no longer bridge empty regions: With several frames joined into one histogram, a Histogram-fit curve drew long lines across ranges where its series has no data, connecting it to other series' regions. The curve now stays over its own bins.
- Curve options pointing at a removed query no longer break rendering: A stale series reference in the curve or bell-curve options could crash panel drawing; such curves are now skipped. A fitted Gaussian mean of exactly 0 is also no longer ignored by the Gaussian Peak (µ) control line.
1.5.1
Bug Fixes
- Wide queries now show every measurement in the statistics table: When a single query returns several value columns (for example
part_aandpart_bin one result), the histogram already drew a distribution for each, but the statistics table only listed the first one. It now shows one row per value column, each with its own n, Mean, Std Dev, Min, Max and control limits. - Missing values no longer skew subgroup calculations: With subgrouping or aggregation enabled, empty/null readings inside a subgroup were being treated as zero, pulling means and ranges toward 0 (and a fully empty subgroup could produce bad values). Missing readings are now ignored, and a subgroup with no data simply leaves a gap.
- Correct series label on collapsed control lines: The series name shown on a collapsed control-line header could be wrong (or read "(stale series)") when a feature/reference query came before the plotted data. Each control line now shows the correct series it applies to.
1.5.0
Breaking changes
- Statistics table is now a Minitab-style capability report: n, Mean, Std Dev, Min and Max describe the raw individual measurements (not the plotted subgroup aggregates). Cp/Cpk use the within-subgroup sigma estimated the way Minitab does - Rbar/d2 for Xbar-R charts, sbar/c4 for Xbar-S, average moving range/d2 for XmR and ungrouped data, pooled standard deviation (with c4 unbiasing) for subgrouped data without a chart. Pp/Ppk use the overall sample standard deviation of the individuals. Previously all of these were computed from the aggregated (e.g. subgroup-mean) values, which overstated capability by roughly √subgroup-size. LCL/UCL still show the control chart limits.
Bug Fixes
- Capability indices now work with spec limits from a query: When the LSL and USL lines get their values from a data field (Position input = Series, e.g. limits pulled from a reference/feature query), the statistics table now calculates Cp, Cpk, Pp and Ppk. Previously these were left blank unless the limits were typed in as fixed values, even though the limit lines still showed on the chart. The exported CSV now includes these limits too.
- S chart lower control limit used the wrong constant: the LCL was computed with A3 instead of B3, producing an incorrect lower limit for every subgroup size.
- Standard deviation ignored missing data incorrectly: null and NaN values could distort (or poison) the Std Dev statistic; it is now computed over valid values only.
- Control limits from partial subgroups: Xbar-R/S center lines and limits are now estimated from complete subgroups only, and charts with insufficient data no longer produce NaN limits.
- CSV export dropped static control lines when a feature query was configured (series index mismatch).
1.4.2
Features
- Statistics column editor: Added an info tooltip explaining the requirements for Cp, Cpk, Pp, and Ppk to appear (both LSL and USL must be configured, sufficient data points required).
Bug Fixes
- Fix spec limits from feature series: LSL and USL control lines configured to pull values from a feature series field were not being resolved correctly; capability indices now reflect the actual series value.
- Multi-series spec limit fallback: When a series has no LSL/USL configured, it now falls back to the limits defined for the first series, so a single pair of spec limits applies to all series by default.
- Theme consistency: Replaced remaining hardcoded values with Grafana theme tokens — control line default colors now use the visualization palette (
dark-green,dark-red,blue, etc.), hover range and tooltip offset usetheme.spacing(), and annotation colors are resolved viatheme.visualization.getColorByName(). - Grafana dependency: Minimum required Grafana version bumped to 11.6.10.
1.4.1
- Theme consistency: Replaced hardcoded pixel values and hex color constants with Grafana theme tokens (
theme.spacing(),theme.colors.*,theme.visualization.getColorByName()) across editor and tooltip components, improving light/dark mode consistency. - Documentation: Updated plugin and usage documentation.
1.4.0
- Export to CSV: Export calculated SPC data (statistics, control lines, and histogram buckets) to a CSV file. Available from the download icon in the statistics table header or by right-clicking the panel and selecting "Download CSV".
- Statistics Table: Added a statistics table below the histogram showing descriptive statistics (n, Mean, Std Dev, Min, Max), control limits (LCL, UCL), and process capability indices (Cp, Cpk, Pp, Ppk).
- Configurable Table Columns: Choose which columns to display in the statistics table via the panel editor.
- Multiple Custom Lines per Series: You can now add more than one custom control line to a single series.
- Gaussian Peak (µ) Control Line: New control line type that marks the peak of the fitted Gaussian curve. Uses the Levenberg-Marquardt fitted mean, which may differ from the arithmetic mean for non-normal data.
- Histogram Tooltip: Hover over histogram bins to see bucket range and count for each series, similar to Grafana's built-in histogram tooltip. Bell curve fitted values are included when a Gaussian curve is configured.
1.3.0
- Added support for Custom Control Lines to pull dynamic values from Feature Series, allowing more flexible histogram configurations.
- Added the ability to mark series as Feature Series and hide them from the histogram.
- Introduced support for a subgroupSize dashboard variable to control subgroup size across multiple SPC Histogram panels.
1.2.0
- Gaussian Curve Functionality: You can now add a Gaussian (normal distribution) curve to your histograms.
- Histogram Curve: A new option to plot a smoothed curve along your histogram for better data visualization.
- Bug Fixes: We've squashed a few bugs to improve overall performance.
- New Documentation: Check out the updated documentation


