Plugins 〉SPC Box Plot
SPC Box Plot
SPC Box Plot
Visualize process data distributions as box plots with built-in Statistical Process Control — right inside Grafana. SPC Box Plot groups your measurements into subgroups, draws standard box-and-whisker plots, and overlays robust Xf-Rf control limits so you can detect shifts in process spread and location at a glance.

Why SPC Box Plot?
Control charts tell you when your process changes. Box plots tell you how the distribution changes — median, spread, quartiles, and outliers all in one view. Combine them and you get both.
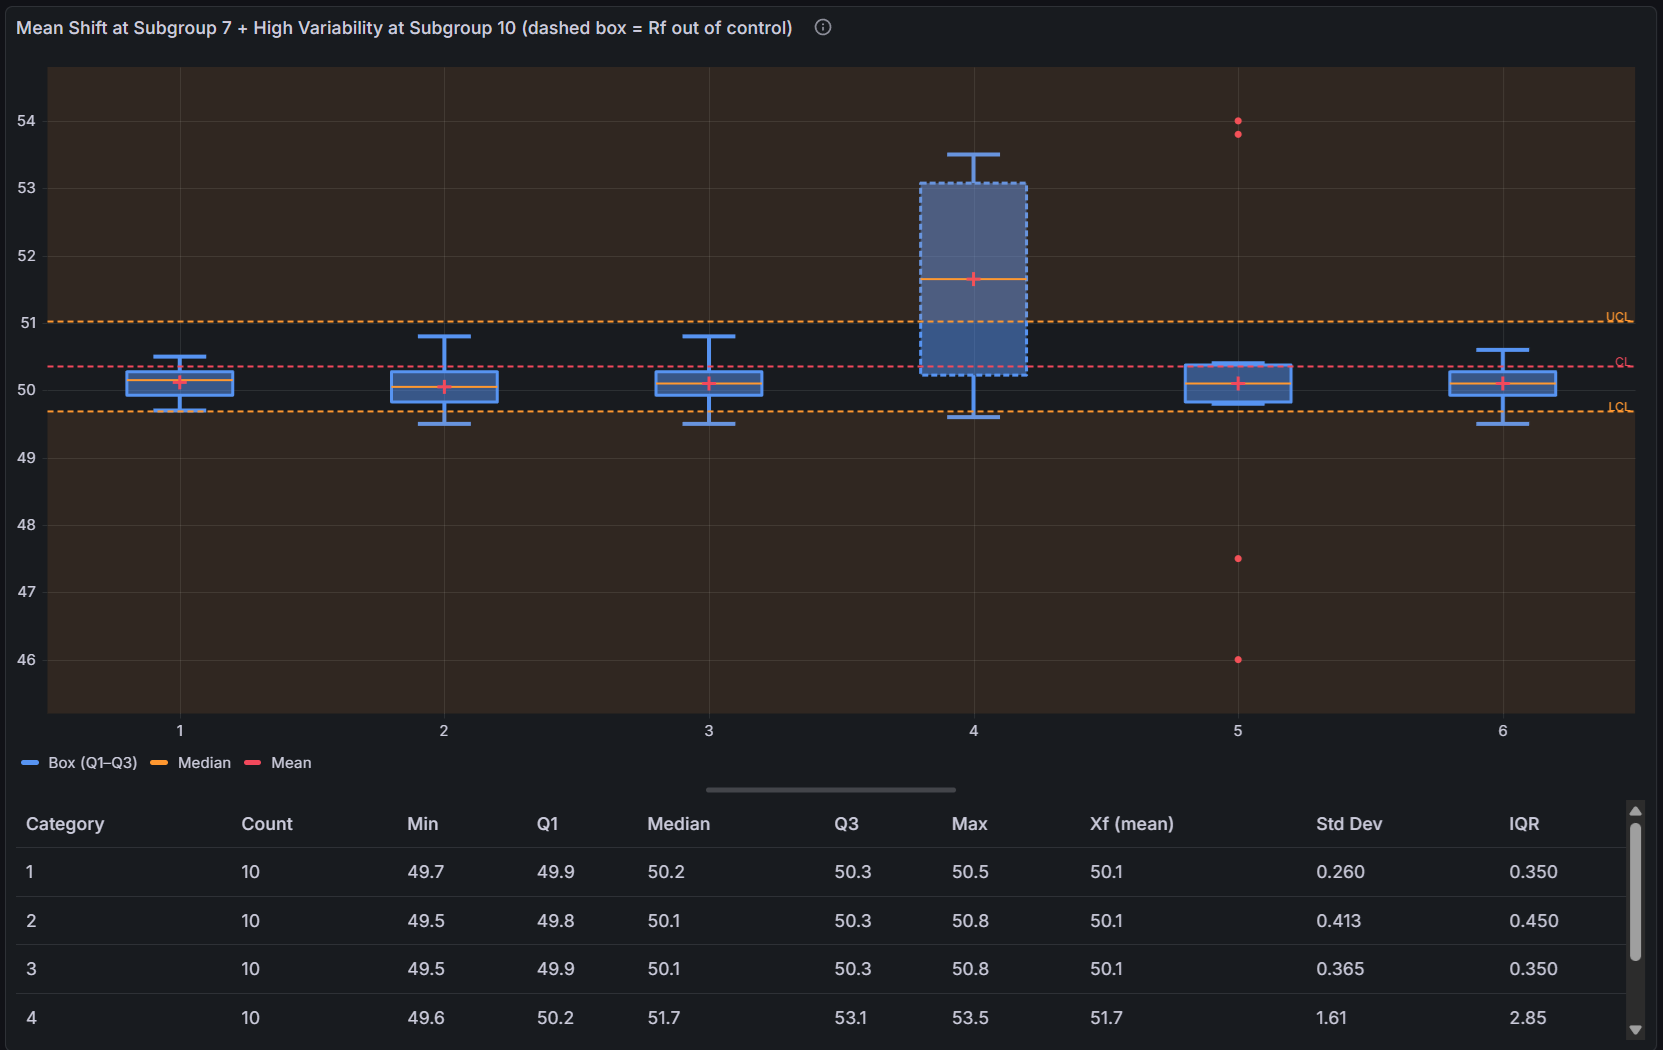
- Resistant control limits — the Xf-Rf method (Peixoto 2003) uses the middle half of each subgroup, so a few outliers cannot skew your limits
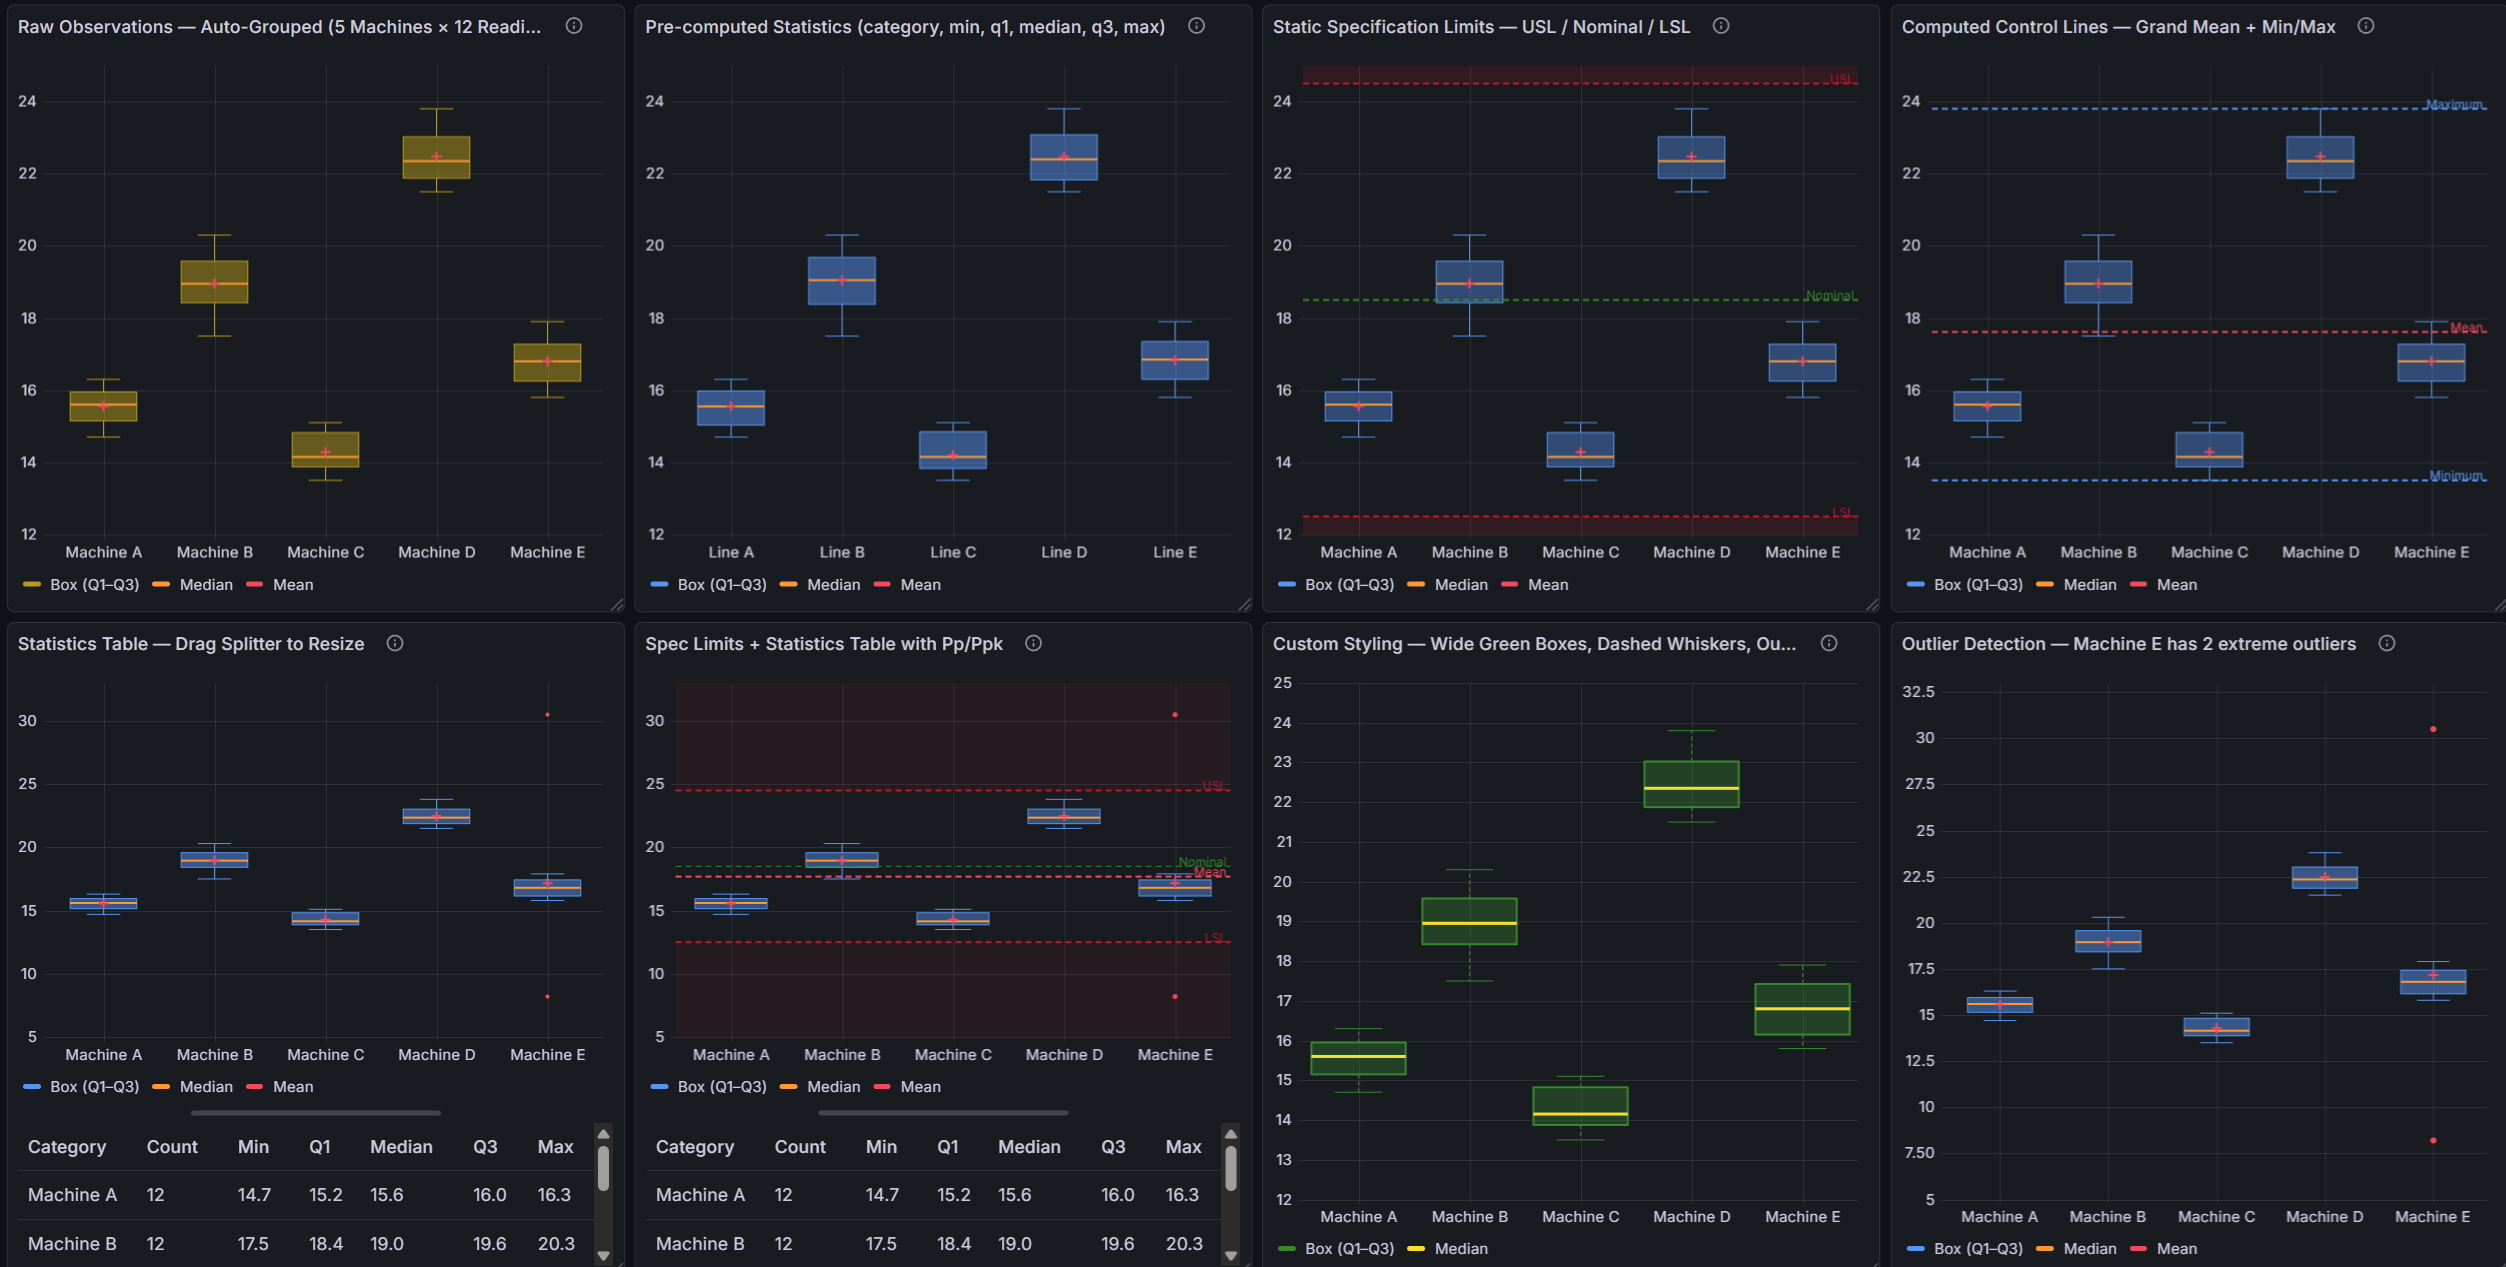
- Three input modes — works with raw time series data, categorically grouped observations, or pre-computed box statistics from your database
- Outlier visibility — individual points beyond 1.5 × IQR are plotted separately so they never disappear into the box
- Capability at a glance — add LSL/USL lines and the statistics table automatically shows Cp, Cpk, Pp, and Ppk for every subgroup

Features
| Feature | Description |
|---|---|
| Box-and-whisker plots | Q1/Q3 box, median line, whiskers (1.5 × IQR), individual outlier points |
| Mean marker | Optional marker at the subgroup mean |
| Xf-Rf SPC | Robust control limits using resistant estimators (Peixoto 1992/2003) |
| Three data modes | Auto-detects time series, categorical, or pre-computed input |
| Control lines | LCL, UCL, Mean, Min, Max, Range, LSL, USL, Custom, Nominal |
| Fill regions | Shade areas between control lines to highlight process zones |
| Statistics table | n, Mean, Std Dev, Min, Max, Q1, Median, Q3, IQR, Cp, Cpk, Pp, Ppk |
| Resizable layout | Drag the splitter between chart and statistics table |
| Dashboard variables | subgroupsize variable to control all panels from one dropdown |
Getting Started
- Install from the Grafana Plugin Catalog.
- Add a panel and select SPC Box Plot.
- Connect any data source returning numeric time series data.
- Enable SPC in the panel options and set your subgroup size (4–15).
- Add LCL and UCL control lines to see the process control zone.
- Add LSL and USL lines to enable capability index calculations.

Documentation
For the complete feature reference — all panel options, data mode schemas, Xf-Rf formulas, capability index definitions, and dashboard variable configuration — see the full documentation.
Part of the KensoBI SPC Suite
SPC Chart Panel — XmR, Xbar-R, and Xbar-S control charts for monitoring process stability over time.
SPC Histogram Panel — Distribution analysis with histograms, bell curves, and capability indices.
SPC Pareto Panel — Identify the most significant contributors to defects or downtime.
SPC CAD Panel — Bind SPC data to 3D part geometry for visual quality inspection.
SPC Characteristic Datasource — The datasource that powers the SPC CAD panel. Connects to your measurement database (PostgreSQL or MSSQL), lets you select features and characteristics through a point-and-click interface, and returns SPC statistics, time series measurements, and forecast data - no SQL required.
License
This software is distributed under the Kenso Software Commercial License. Use requires a valid commercial license. No open-source rights are granted.
Getting Help
- Contact support at https://kensobi.com/contact
- KensoBI Discord
Grafana Cloud Free
- Free tier: Limited to 3 users
- Paid plans: $55 / user / month above included usage
- Access to all Enterprise Plugins
- Fully managed service (not available to self-manage)
Self-hosted Grafana Enterprise
- Access to all Enterprise plugins
- All Grafana Enterprise features
- Self-manage on your own infrastructure
Installing SPC Box Plot on Grafana Cloud:
Installing plugins on a Grafana Cloud instance is a one-click install; same with updates. Cool, right?
Note that it could take up to 1 minute to see the plugin show up in your Grafana.
Warning
Plugin installation from this page will be removed in February 2026. Use the Plugin Catalog in your Grafana instance instead. Refer to Install a plugin in the Grafana documentation for more information.
Installing plugins on a Grafana Cloud instance is a one-click install; same with updates. Cool, right?
Note that it could take up to 1 minute to see the plugin show up in your Grafana.
Installing plugins on a Grafana Cloud instance is a one-click install; same with updates. Cool, right?
Note that it could take up to 1 minute to see the plugin show up in your Grafana.
Warning
Plugin installation from this page will be removed in February 2026. Use the Plugin Catalog in your Grafana instance instead. Refer to Install a plugin in the Grafana documentation for more information.
Installing plugins on a Grafana Cloud instance is a one-click install; same with updates. Cool, right?
Note that it could take up to 1 minute to see the plugin show up in your Grafana.
Marketplace plugins
This is a paid plugin developed by a marketplace partner. To purchase an entitlement, sign in first, then fill out the contact form.
Get this plugin
This is a paid for plugin developed by a marketplace partner. To purchase entitlement please fill out the contact us form.
What to expect:
- Grafana Labs will reach out to discuss your needs
- Payment will be taken by Grafana Labs
- Once purchased the plugin will be available for you to install (cloud) or a signed version will be provided (on-premise)
Thank you! We will be in touch.
For more information, visit the docs on plugin installation.
Installing on a local Grafana:
For local instances, plugins are installed and updated via a simple CLI command. Plugins are not updated automatically, however you will be notified when updates are available right within your Grafana.
1. Install the Panel
Use the grafana-cli tool to install SPC Box Plot from the commandline:
grafana-cli plugins install The plugin will be installed into your grafana plugins directory; the default is /var/lib/grafana/plugins. More information on the cli tool.
Alternatively, you can manually download the .zip file for your architecture below and unpack it into your grafana plugins directory.
Alternatively, you can manually download the .zip file and unpack it into your grafana plugins directory.
2. Add the Panel to a Dashboard
Installed panels are available immediately in the Dashboards section in your Grafana main menu, and can be added like any other core panel in Grafana.
To see a list of installed panels, click the Plugins item in the main menu. Both core panels and installed panels will appear.
Changelog
1.0.0
Initial release.


