Plugins 〉SPC Bullet


SPC Bullet


SPC Bullet
A versatile bar visualization panel that works as a progress bar, bar gauge, or full bullet chart with qualitative background zones — with optional SPC (Statistical Process Control) mode to display process capability indices like Cpk, Ppk, and Sigma Level, computed directly from your time series data.
Why SPC Bullet?
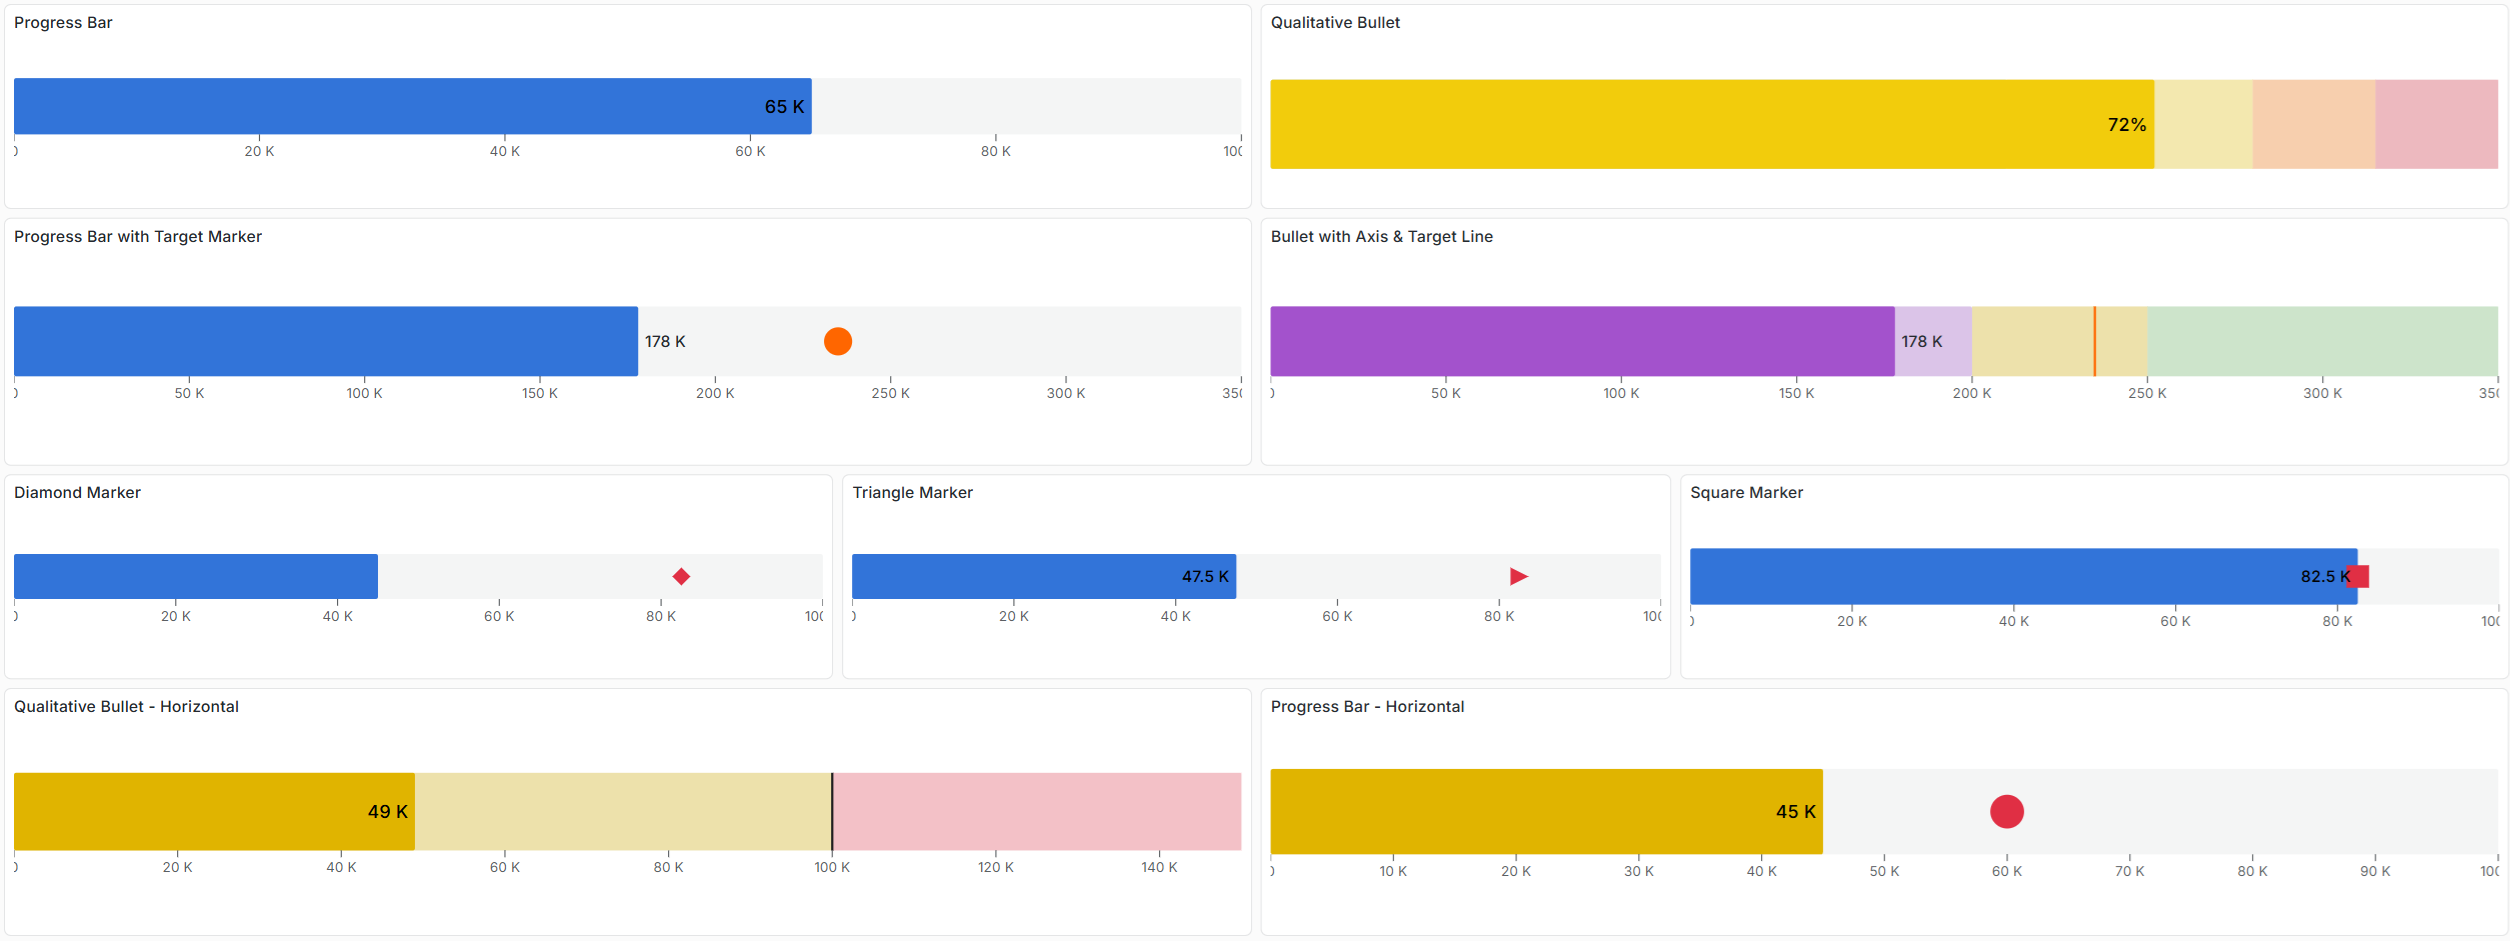
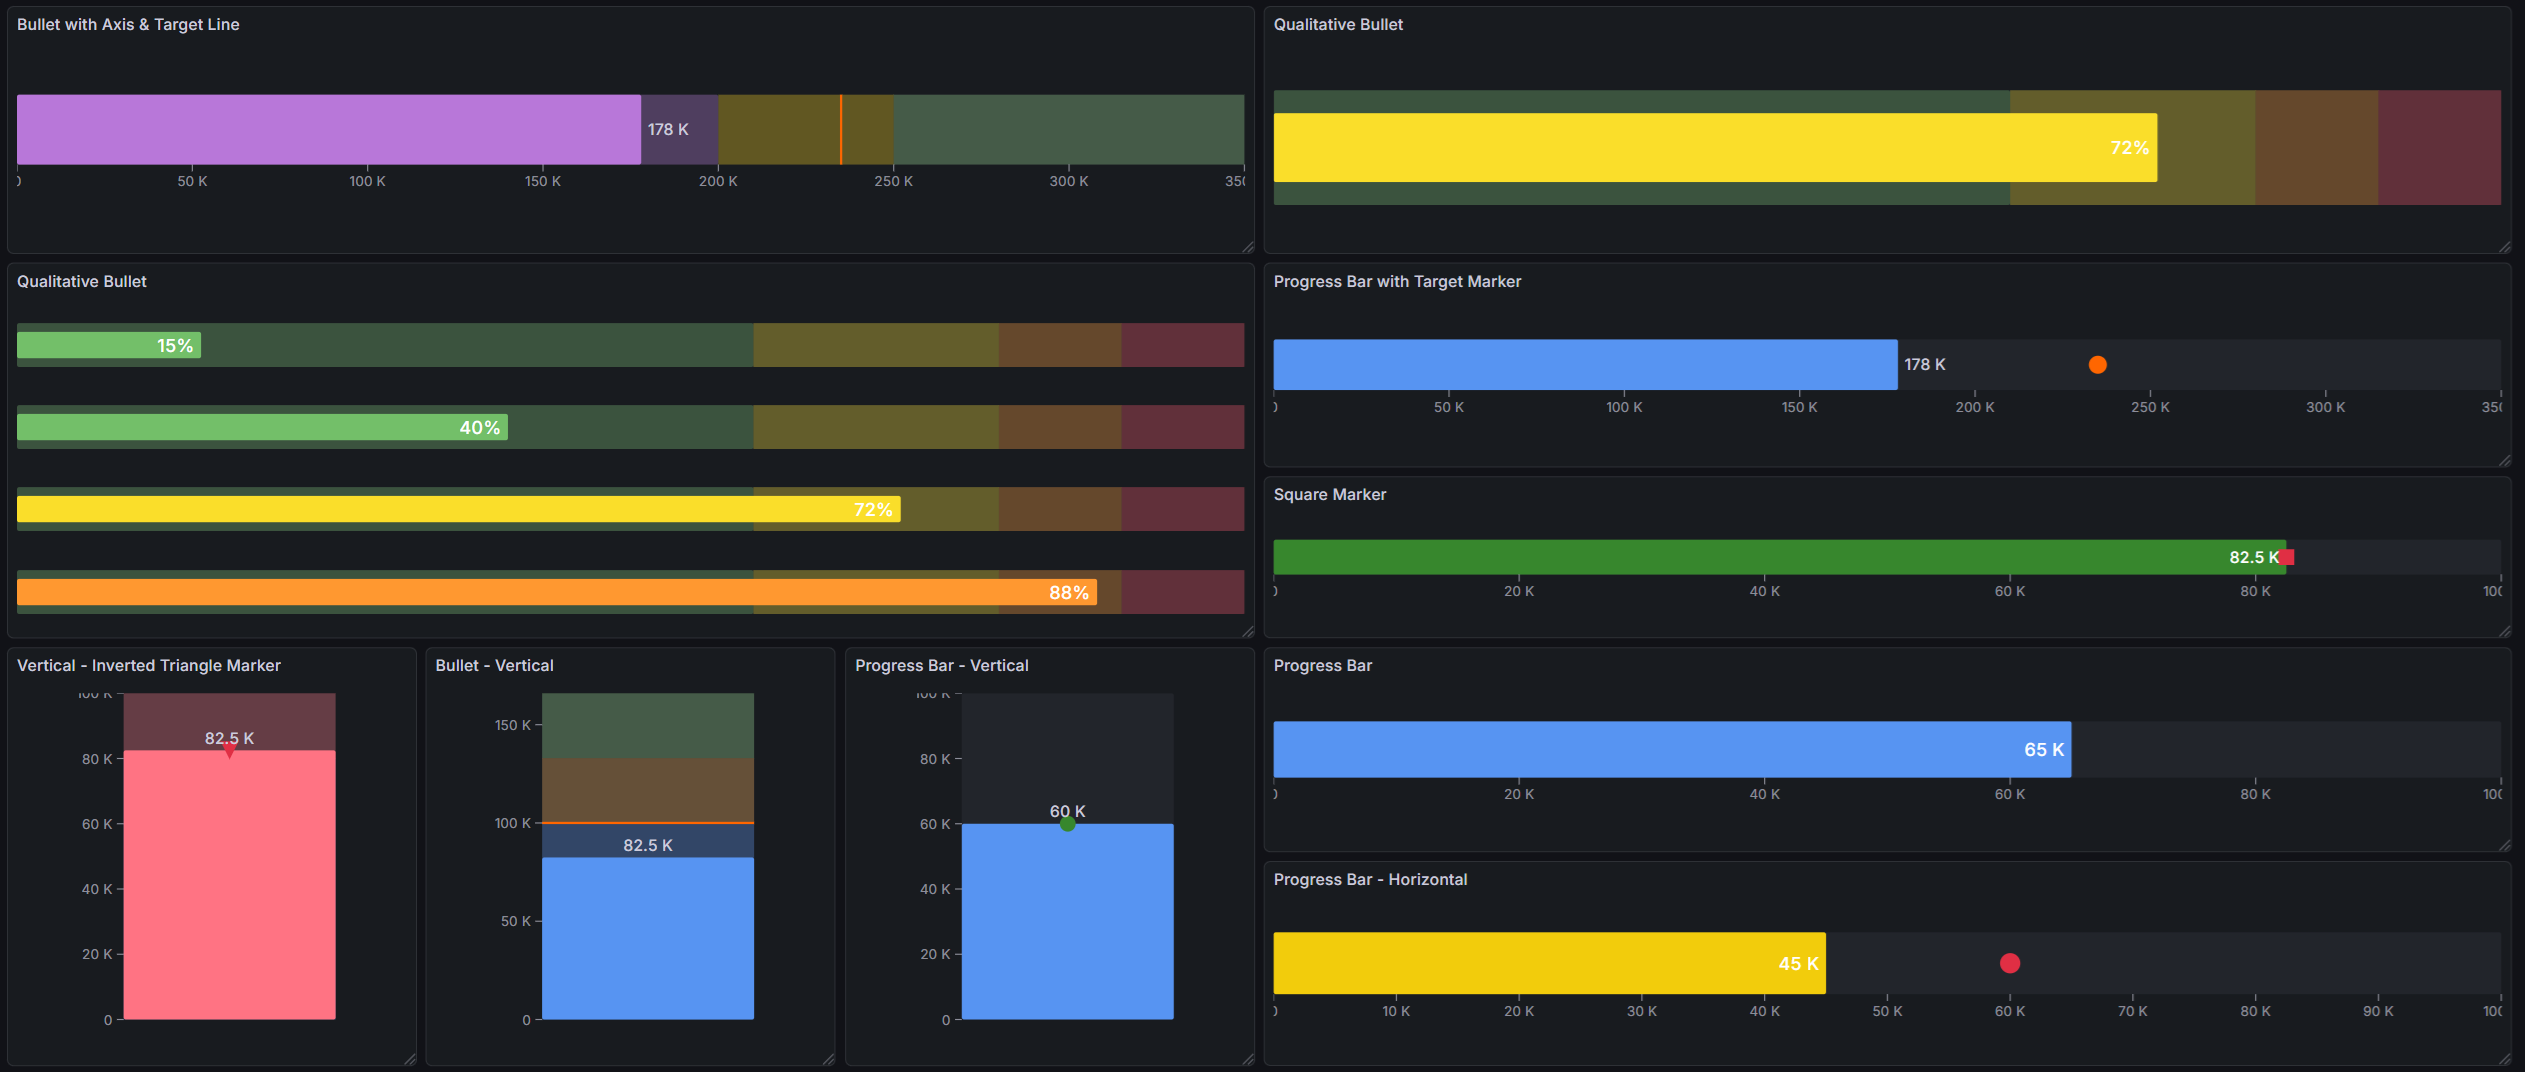
Bullet charts communicate more information than a single gauge. In one compact bar you see the current value, the target, and the qualitative performance context — all without building separate panels or complex transformations.
- Progress bar — clean fill bar for completion percentages, utilization, or any 0–100% metric
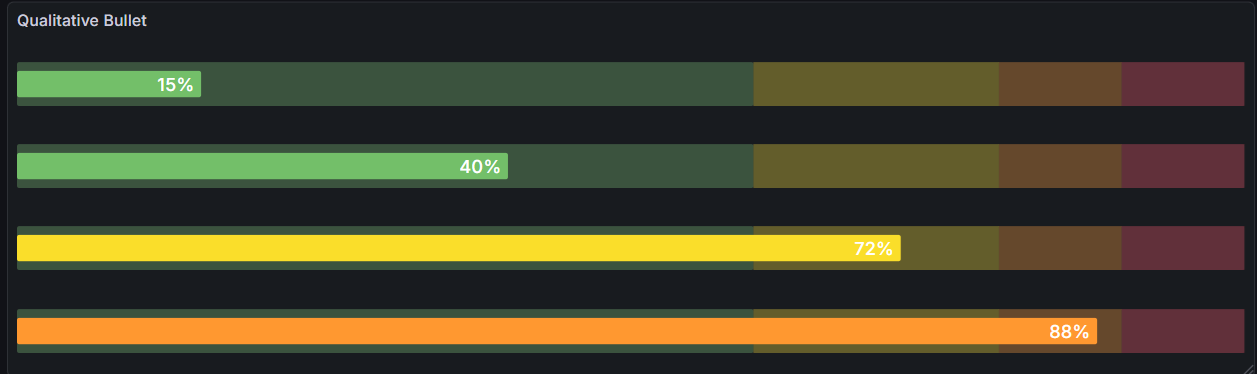
- Bullet chart — qualitative background zones from Grafana thresholds show whether performance is acceptable at a glance
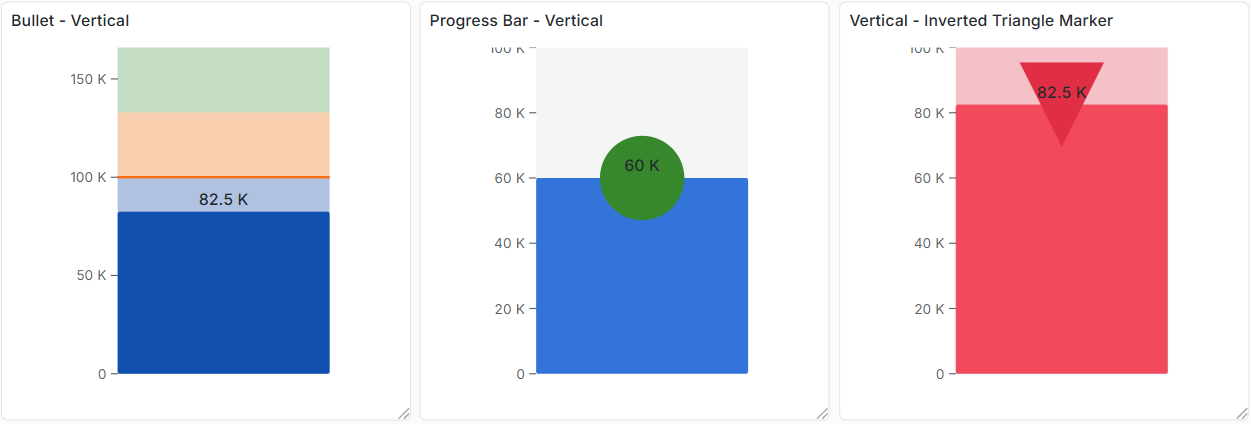
- Target marker — compare actual vs. goal with a secondary marker from any data field
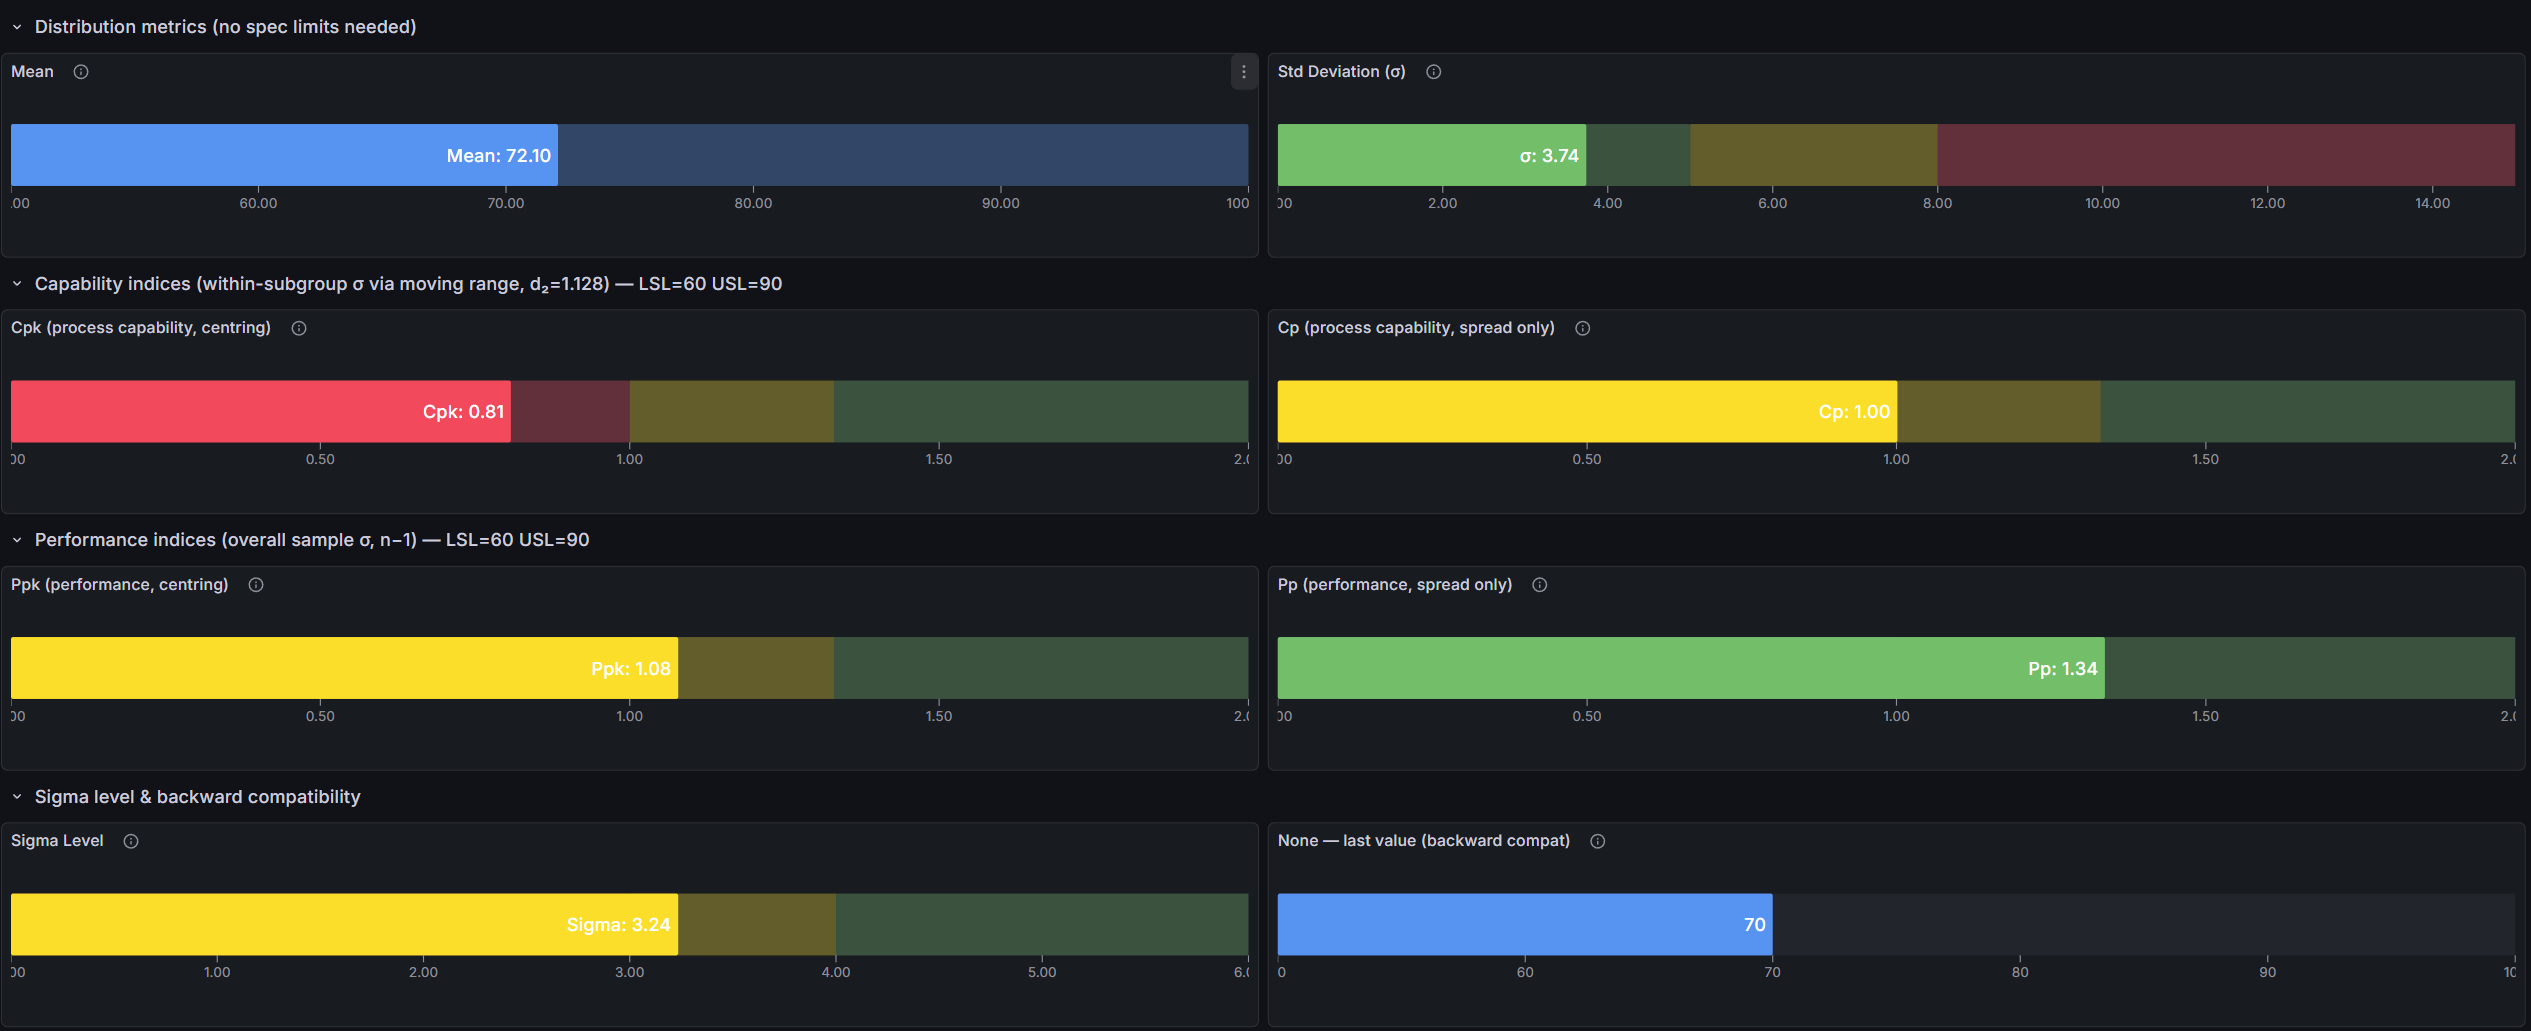
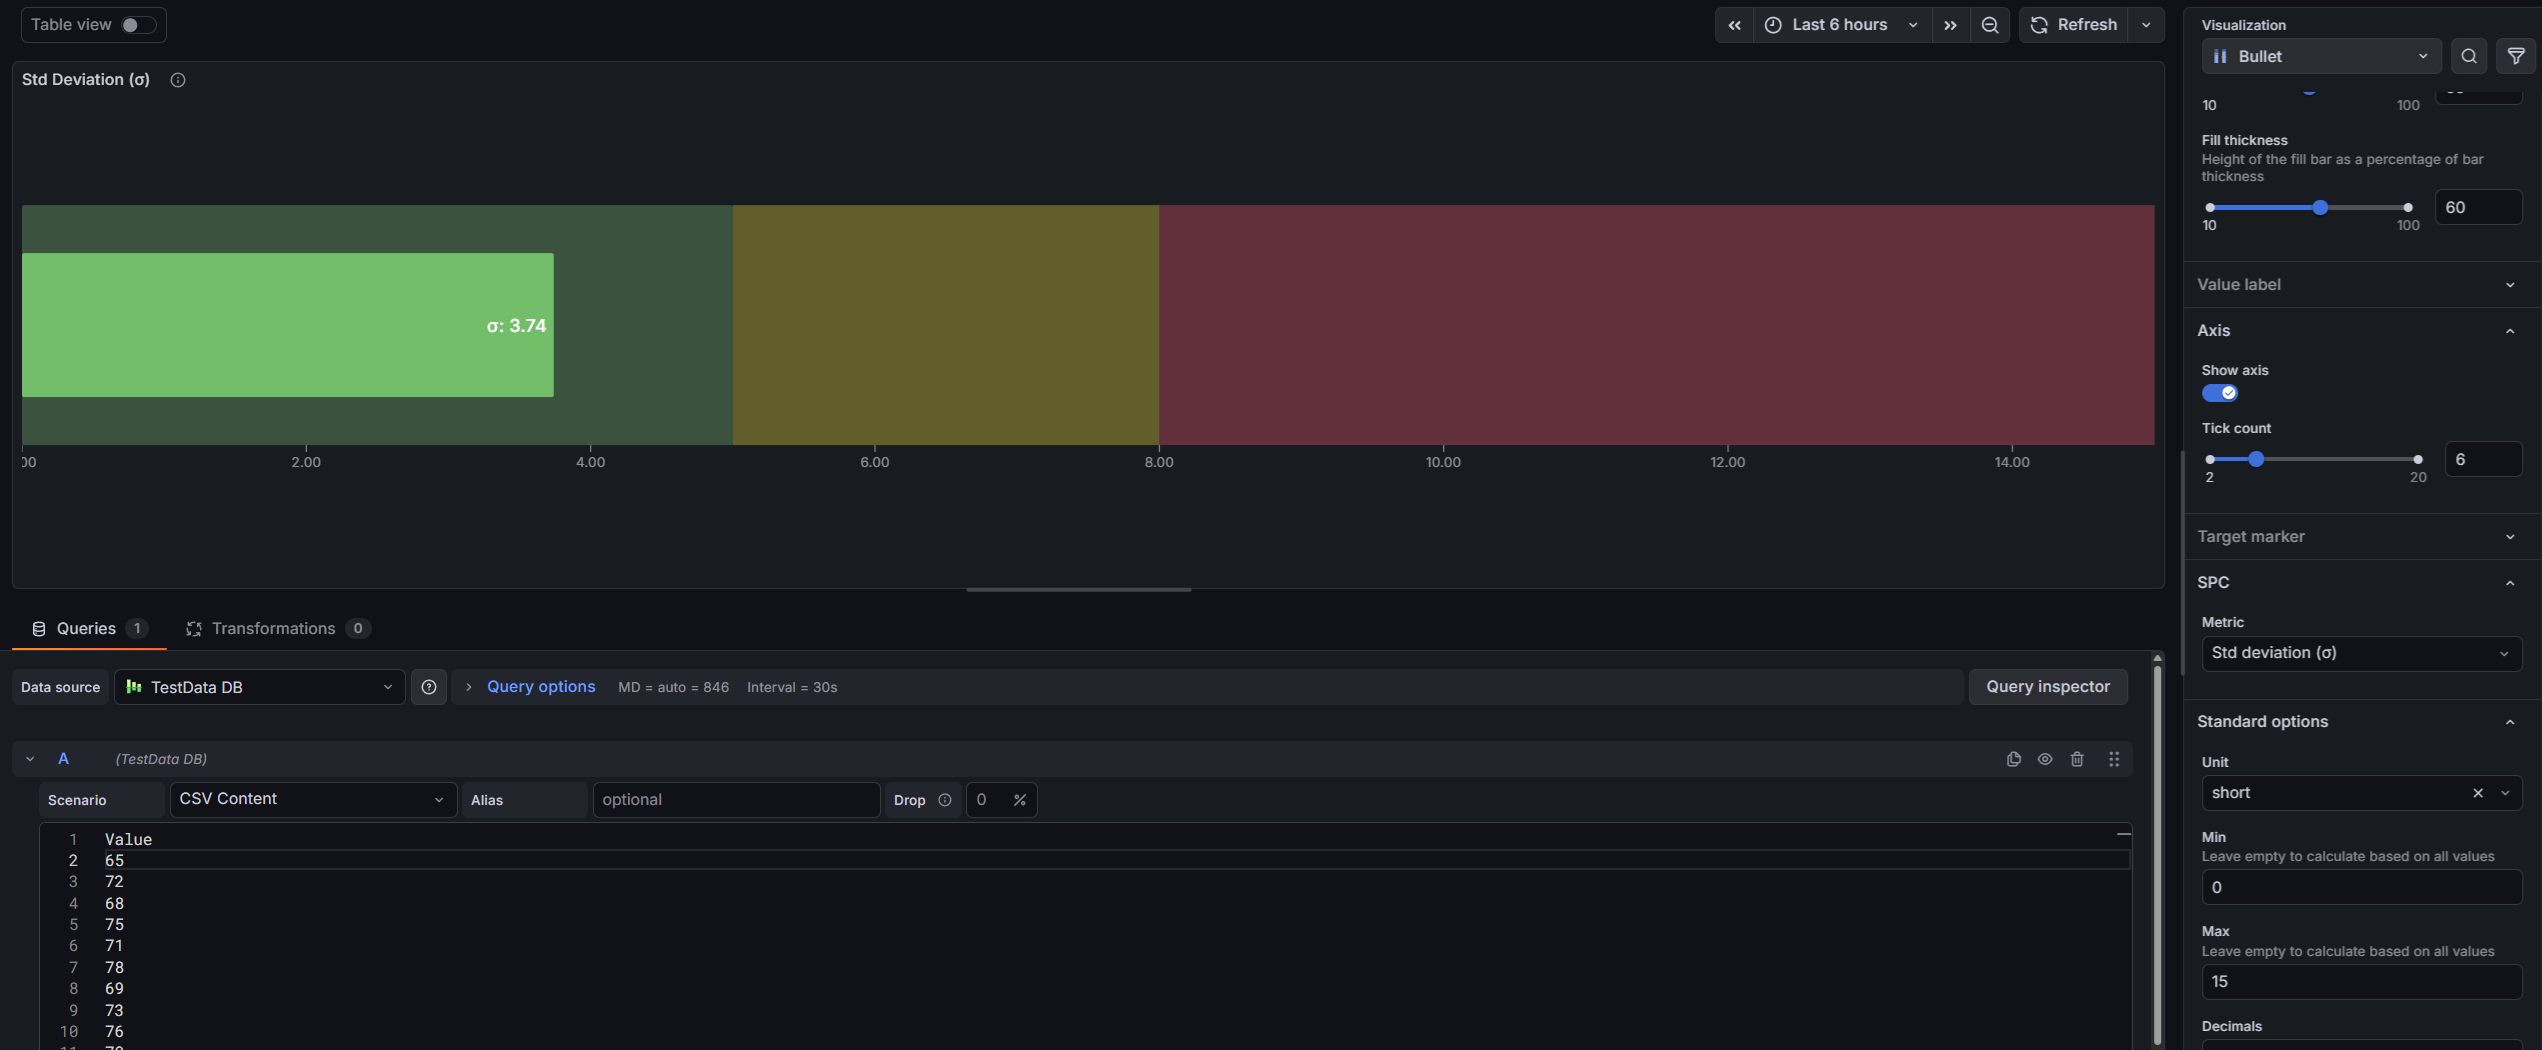
- SPC metrics (optional) — display Mean, Std Dev, Cpk, Cp, Ppk, Pp, or Sigma Level computed from the full time series
Built for Grafana
- Native theming — automatically adapts to light and dark mode
- Standard field options — min, max, units, decimals, and field overrides work just like any other Grafana panel
- Threshold integration — fill color and background zones are driven by Grafana's built-in threshold editor
- Works with any data source — SQL databases, Prometheus, InfluxDB, CSV files, or any other Grafana data source
Features
| Feature | Description |
|---|---|
| Progress bar mode | Simple filled bar with threshold-based color |
| Bullet chart mode | Filled bar with semi-transparent qualitative background zones from thresholds |
| Target marker | Secondary marker from a data field — 6 configurable shapes |
| Horizontal & vertical | Full support for both orientations |
| Value label | Numeric value displayed inside or outside the bar with configurable font size |
| Axis | Optional scale axis with smart tick formatting |
| SPC metrics (optional) | Mean, Std Dev, Cpk, Cp, Ppk, Pp, Sigma Level — computed from the full series |
| Specification limits | LSL and USL for capability and sigma level calculations |
| Multi-series support | One bullet per data series, stacked automatically |
Use Cases
- Manufacturing KPIs — display Cpk or Ppk for each process parameter on a single dashboard page
- OEE dashboards — show availability, performance, and quality as bullet bars against targets
- Production progress — track shift output vs. daily target with a compact progress bar
- Quality scorecards — summarize process health across many parameters in a grid of bullets
- IT operations — monitor SLA compliance with clear red/yellow/green performance zones
- Laboratory — display capability indices against specification limits for each measured characteristic
Requirements
- Grafana 11.6.2 or later
Getting Started
- Install the plugin from the Grafana Plugin Catalog
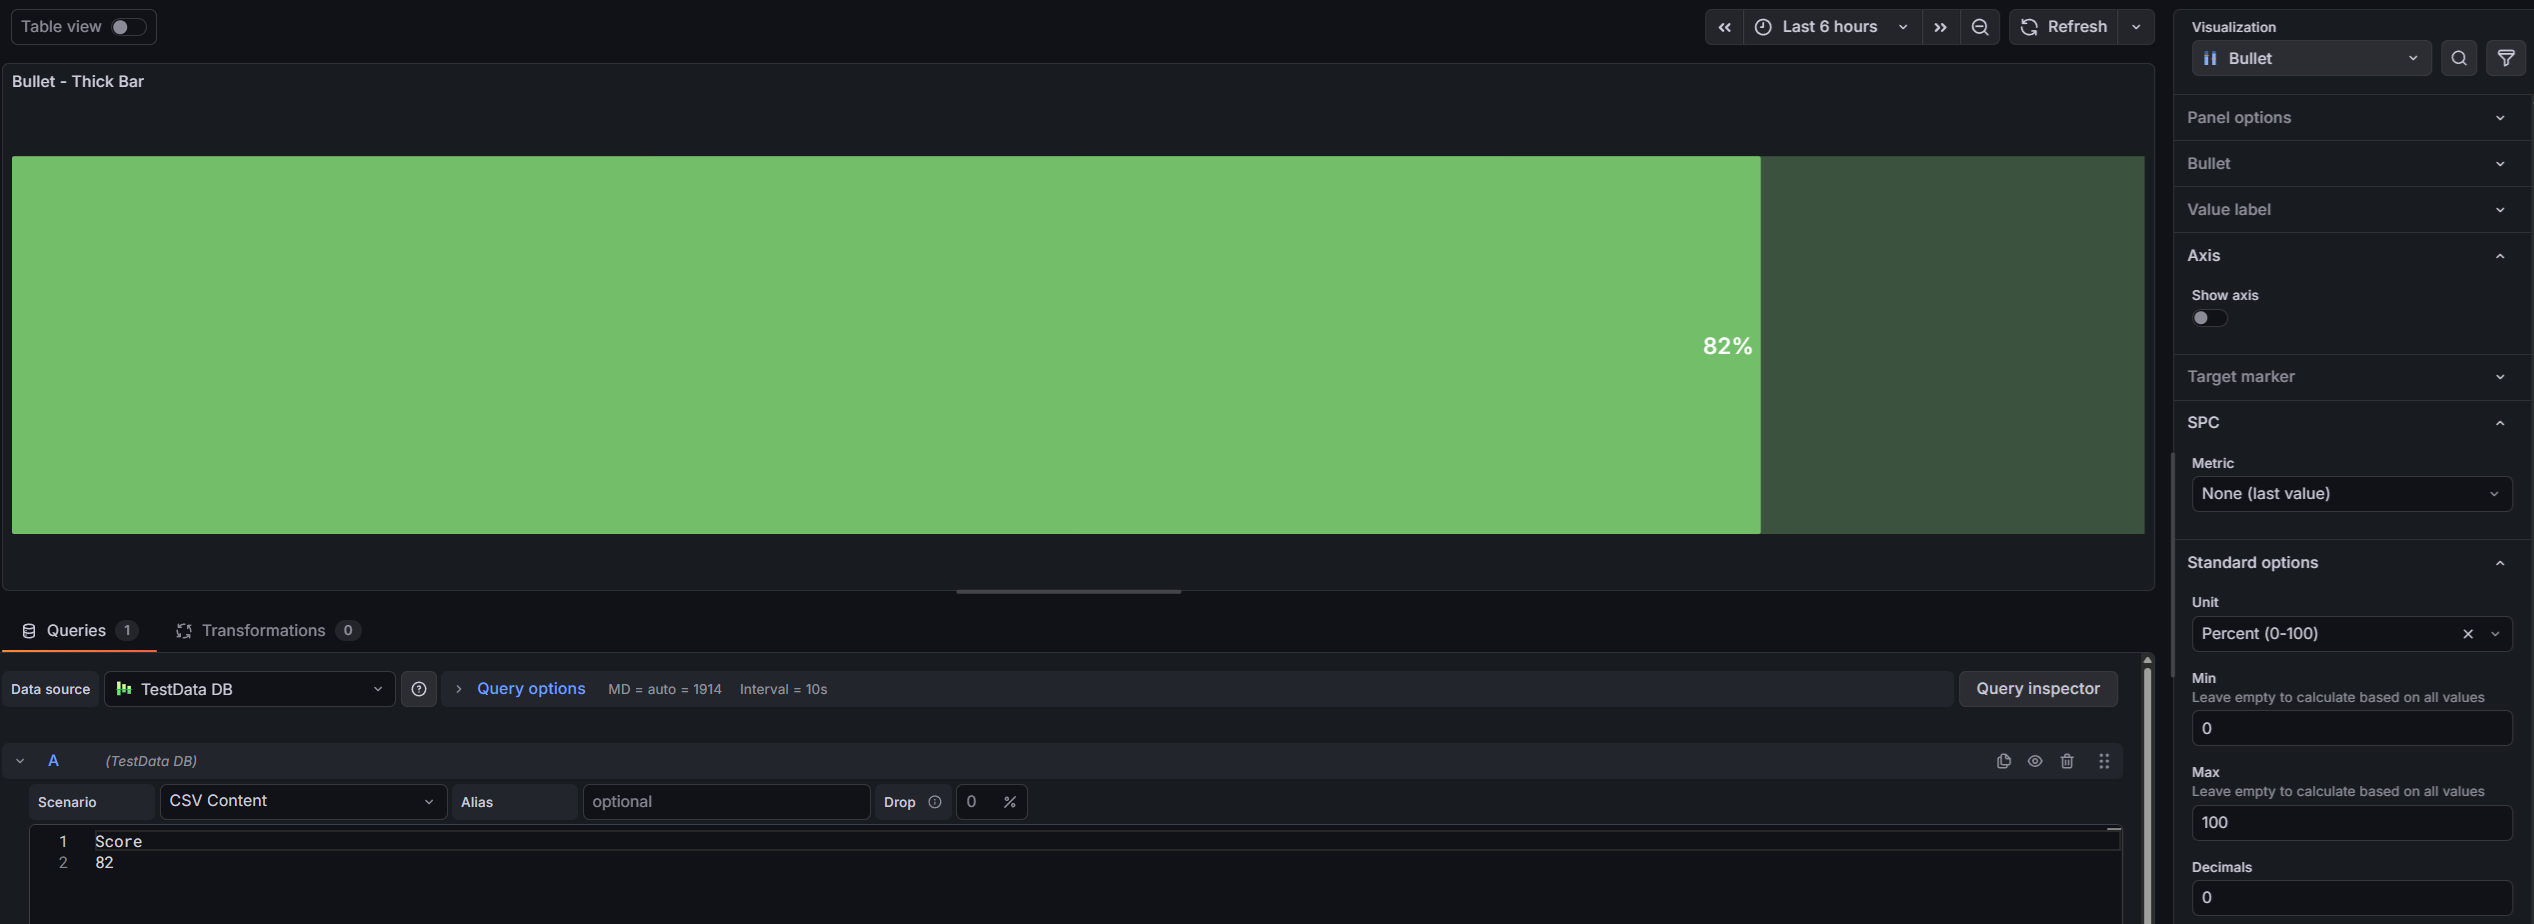
- Add a new panel and select Bullet as the visualization
- Connect a data source with numeric data
- Set Min and Max in field configuration to define the bar scale
- Add Thresholds for color zones and bullet background ranges
- Optionally select a Target marker field and configure its shape
- Optionally enable SPC > Metric (e.g., Cpk) to display a process capability metric
Panel Options

Bullet
| Option | Description | Default |
|---|---|---|
| Bullet mode | Progress bar or Bullet (with background zones) | Bullet |
| Orientation | Horizontal or Vertical | Horizontal |
| Bar thickness | Bar width as % of available space | 50% |
| Fill thickness | Fill bar height as % of bar thickness | 100% |
Value Label
| Option | Description | Default |
|---|---|---|
| Show | Display the numeric value on the bar | On |
| Placement | Inside (right-aligned) or Outside (left-aligned) | Inside |
| Font size | Text size in pixels (8–48px) | 14px |
Axis
| Option | Description | Default |
|---|---|---|
| Show | Display the scale axis with ticks | Off |
| Tick count | Number of axis ticks (2–20) | 5 |
Target Marker
| Option | Description | Default |
|---|---|---|
| Field name | Data field used as the marker value | (none) |
| Marker shape | Line, Circle, Diamond, Triangle, Inverted Triangle, Square | Line |
| Marker size | Marker size in pixels (4–32px) | 12px |
| Marker color | Marker color | semi-dark-orange |
SPC (optional)
SPC mode is disabled by default. Set Metric to any value other than None to enable it.
| Option | Description | Default |
|---|---|---|
| Metric | None, Mean, Std Dev, Cpk, Cp, Ppk, Pp, Sigma Level | None |
| LSL | Lower specification limit | 0 |
| USL | Upper specification limit | 100 |
Documentation
For detailed documentation, configuration guides, and examples, see the full documentation.
Part of the KensoBI SPC Suite
SPC Bullet is part of a growing family of Statistical Process Control plugins for Grafana by Kenso Software:
SPC Chart Panel — Control charts for monitoring process stability over time. Supports XmR, Xbar-R, and Xbar-S charts with automatic calculation of control limits.
SPC Histogram Panel — Distribution analysis with histograms, bell curves, and a built-in statistics table showing Cp, Cpk, Pp, and Ppk.
SPC Box Plot Panel — Box-and-whisker plots with built-in SPC. Automatically groups measurements into subgroups, computes quartiles and outliers, and overlays Xf-Rf control limits to detect shifts in both process location and spread.
SPC Pareto Panel — Pareto charts for identifying the most significant factors contributing to defects or issues.
SPC CAD Panel — Brings 3D geometry into the picture, letting you bind the data from control charts and histograms to physical features on your parts.
SPC Characteristic Datasource — The datasource that powers the SPC CAD panel. Connects to your measurement database (PostgreSQL or MSSQL), lets you select features and characteristics through a point-and-click interface, and returns SPC statistics, time series measurements, and forecast data - no SQL required.
License
This software is distributed under the Kenso Software Commercial License. Use requires a valid commercial license. No open-source rights are granted.
Support
If you have any questions or feedback, you can:
- Contact support at https://kensobi.com/contact
- Join the KensoBI Discord for questions and discussion.
Grafana Cloud Free
- Free tier: Limited to 3 users
- Paid plans: $55 / user / month above included usage
- Access to all Enterprise Plugins
- Fully managed service (not available to self-manage)
Self-hosted Grafana Enterprise
- Access to all Enterprise plugins
- All Grafana Enterprise features
- Self-manage on your own infrastructure
Install on Grafana Cloud
Plugins can be installed directly from within your Grafana instance or automated using the Cloud API or Terraform.
Learn more about plugin installationMarketplace plugins
This is a paid plugin developed by a marketplace partner. To purchase an entitlement, sign in first, then fill out the contact form.
Get this plugin
This is a paid for plugin developed by a marketplace partner. To purchase entitlement please fill out the contact us form.
What to expect:
- Grafana Labs will reach out to discuss your needs
- Payment will be taken by Grafana Labs
- Once purchased the plugin will be available for you to install (cloud) or a signed version will be provided (on-premise)
Thank you! We will be in touch.
For more information, visit the docs on plugin installation.
Installing on a local Grafana:
For local instances, plugins are installed and updated via a simple CLI command. Plugins are not updated automatically, however you will be notified when updates are available right within your Grafana.
1. Install the Panel
Use the grafana-cli tool to install SPC Bullet from the commandline:
grafana-cli plugins install The plugin will be installed into your grafana plugins directory; the default is /var/lib/grafana/plugins. More information on the cli tool.
Alternatively, you can manually download the .zip file for your architecture below and unpack it into your grafana plugins directory.
Alternatively, you can manually download the .zip file and unpack it into your grafana plugins directory.
2. Add the Panel to a Dashboard
Installed panels are available immediately in the Dashboards section in your Grafana main menu, and can be added like any other core panel in Grafana.
To see a list of installed panels, click the Plugins item in the main menu. Both core panels and installed panels will appear.
Changelog
1.0.2
Bug fixes
- Panel no longer crashes when the data source returns no data.
1.0.1
Initial release.